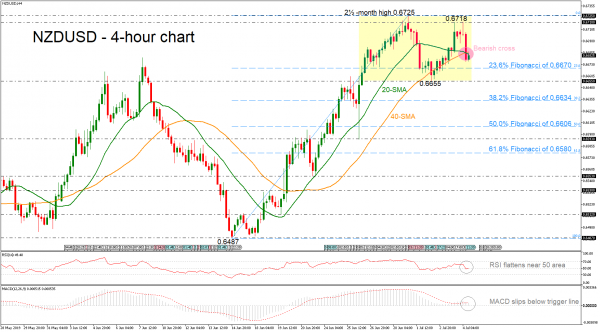
NZDUSD has been consolidating since June 26 within a narrow range of 0.6655 – 0.6718 and is currently hovering beneath the bearish crossover within the 20- and 40-simple moving averages (SMAs) in the 4-hour chart.
The near-term bias is looking neutral-to-bearish as the RSI is flatlining near the 50-neutral level, while the MACD is moving slightly lower below the trigger line in the positive zone, suggesting more downside pressure in the 4-hour chart.
Should the pair pare some of the previous sessions’ losses, it’s likely to meet resistance at the upper band of the sideways channel near 0.6718 and at the two-and-a-half-month peak of 0.6725.
If the current bullish movement fails to hold and prices turn lower again, the 23.6% Fibonacci retracement level of the upward movement of 0.6487 to 0.6725 near 0.6670 could be the immediate support to look for. A potentially more crucial barrier is coming from the 0.6655 area (lower band of the range).
In the near-term picture, NZDUSD would need to make a sustained climb above the two-and-a-half-month high in order for the outlook to become convincingly bullish.
Signal2forex reviews
 Signal2forex.com - Best Forex robots and signals


