Sentiment Analysis in Forex — Complete Guide for Traders (2026)
Sentiment analysis is one of the most powerful yet underutilised tools in forex trading. This guide explains what sentiment analysis is, how to use sentiment indicators like IGCS and COT, and proven contrarian trading strategies — plus an interactive sentiment analyzer to sharpen your entries.
1. What Is Sentiment Analysis in Forex?
Sentiment analysis in forex is the practice of measuring the overall attitude of market participants toward a particular currency pair or the market as a whole. It answers a fundamental question: Is the crowd bullish or bearish?
Unlike technical analysis (which studies price) or fundamental analysis (which studies economic factors), sentiment analysis focuses on market psychology — the collective emotions of fear, greed, optimism, and pessimism that drive price movements.
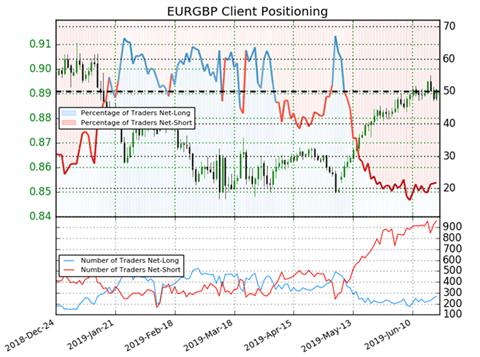
Fig 1: Sentiment analysis bridges the gap between price action and market psychology.
Why Market Sentiment Matters
- Price is driven by participants — behind every chart is a human making a decision
- Sentiment often leads price — changes in sentiment can signal upcoming moves
- Extremes signal reversals — when everyone is on one side, the market often flips
The Psychology Behind Sentiment
- Bullish sentiment — traders expect prices to rise (optimism)
- Bearish sentiment — traders expect prices to fall (pessimism)
- Extreme sentiment — when the majority is overwhelmingly on one side (often a contrarian signal)
- Fear and Greed — the emotional drivers behind retail trader behaviour
2. How Sentiment Analysis Works in Forex
Contrarian Approach — Trading Against the Crowd
The core principle of sentiment analysis is that retail traders are often wrong at major turning points. When the crowd becomes excessively bullish, it may signal that buying power is exhausted and a reversal is imminent. Conversely, extreme bearish sentiment often marks bottoms.
This is why sentiment analysis is often called a contrarian indicator — it suggests trading in the opposite direction of the majority.
Sentiment as a Leading Indicator
Sentiment often leads price. Changes in sentiment can signal upcoming price movements before they appear on the chart. This makes sentiment analysis a valuable addition to any trader’s toolkit.
- Rising bullish sentiment while price stagnates → potential breakout
- Falling bearish sentiment while price holds support → potential reversal
- Extreme sentiment + price divergence → strong reversal signal
3. Top Sentiment Indicators for Forex Traders
There are several sentiment indicators available to forex traders. Each has its strengths and is suited to different trading styles.
1. IG Client Sentiment (IGCS)
- Provider: IG Group — one of the world’s largest retail brokers
- Shows: Percentage of IG clients net-long vs net-short on each instrument
- Update Frequency: Real-time, updated continuously
- Coverage: Forex, commodities, cryptocurrencies, stock indices
- Best For: Day trading, short-term swing trading
2. Commitment of Traders (COT) Report
- Provider: CFTC (Commodity Futures Trading Commission)
- Shows: Positions of commercial hedgers, large speculators, and small traders
- Update Frequency: Weekly — published every Friday at 15:30 ET
- Best For: Swing trading, position trading, longer-term trend analysis
3. Fear & Greed Index
- Measures: Market volatility, investor sentiment, and overall fear/greed levels
- Based On: Options pricing, market momentum, stock price strength, etc.
- Use: Often used as a contrarian indicator at extremes
4. Retail Sentiment Indicators
- Many brokers display their clients’ long/short ratios
- Free tools like Finlogix Sentiment Tool provide real-time data
- TradingView offers various sentiment indicators
| Indicator | Update Frequency | Best For | Data Source |
|---|---|---|---|
| IG Client Sentiment | Real-time | Day trading, short-term | IG clients |
| COT Report | Weekly | Swing trading, position trading | CFTC |
| Fear & Greed Index | Daily | Overall market sentiment | Options & volatility data |
| Retail Sentiment | Real-time/Varies | Contrarian signals | Retail brokers |
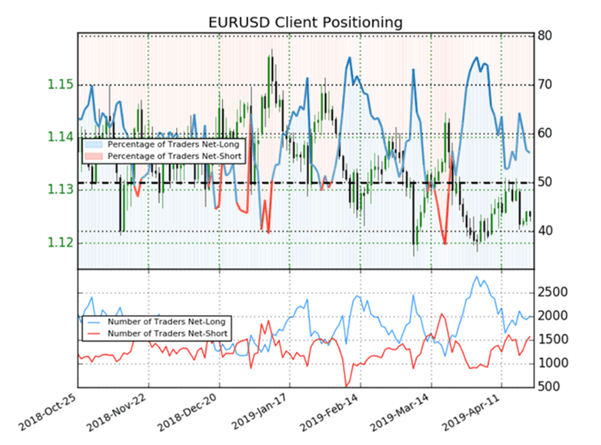
Fig 2: Comparison of key sentiment indicators used by forex traders.
4. How to Read Sentiment Data — Practical Guide
Understanding Long/Short Ratios
- Long % = percentage of traders holding buy positions
- Short % = percentage of traders holding sell positions
- Net sentiment = Long % – Short % (positive = bullish, negative = bearish)
Identifying Sentiment Extremes (60%+ Rule)
- Bullish signal: When 60%+ of traders are short
- Bearish signal: When 60%+ of traders are long
- Extreme signal: 80%+ in one direction — strongest contrarian signal
| Sentiment | % Long | % Short | Signal | Action |
|---|---|---|---|---|
| Extreme Bullish | 80%+ | 20%- | 🔻 Bearish | Consider Short |
| Extreme Bearish | 20%- | 80%+ | 🔺 Bullish | Consider Long |
| Moderate Bullish | 60-79% | 21-40% | ⚠️ Caution | Wait for confirmation |
| Moderate Bearish | 21-40% | 60-79% | ⚠️ Caution | Wait for confirmation |
| Neutral | 40-60% | 40-60% | ➖ Neutral | Range trading |
Tracking Sentiment Changes (Delta)
- Rising longs = increasingly bullish (potential top)
- Rising shorts = increasingly bearish (potential bottom)
- Sharp changes = momentum shift in sentiment
- Daily and weekly changes — watch for accelerating trends
5. Sentiment Trading Strategies
Strategy #1 — Contrarian Reversal
- Signal: Identify extreme sentiment (60%+ in one direction)
- Action: Wait for price confirmation (reversal candle, breakout)
- Entry: Enter in the opposite direction of the crowd
- Stop-Loss: Place beyond recent swing high/low
- Example: 75% long on EUR/USD → bearish signal → short entry
Strategy #2 — Trend Confirmation
- Signal: Use sentiment to confirm the current trend
- Action: Bullish trend + rising shorts = strong uptrend
- Action: Bearish trend + rising longs = strong downtrend
- Stop-Loss: Below/above recent swing level
Strategy #3 — Sentiment Divergence
- Signal: Price and sentiment move in opposite directions
- Bullish divergence: Price makes new low, sentiment less bearish
- Bearish divergence: Price makes new high, sentiment less bullish
- Action: Trade in the direction of the divergence
| Strategy | Entry Signal | Stop-Loss | Take-Profit |
|---|---|---|---|
| Contrarian Reversal | 60%+ extreme + confirmation candle | Beyond recent S/R | Next S/R level |
| Trend Confirmation | Sentiment aligns with trend | Below/above trendline | Trail with trend |
| Sentiment Divergence | Price/sentiment divergence | Beyond recent extreme | Opposite extreme |
6. Real-World Examples (2026)
Example 1 — EUR/USD Contrarian Signal at Resistance
In early 2026, EUR/USD approached a key resistance level at 1.0950. IG Client Sentiment showed 74% of retail traders net-long — a strong contrarian signal. The price formed a Shooting Star candlestick confirming the bearish bias.
- Entry: 1.0930 (on confirmation candle)
- Stop-loss: 1.0980 (above resistance and wick)
- Take-profit: 1.0780 (next support level)
- Risk/Reward: ~1:3
Example 2 — GBP/USD Sentiment Divergence
GBP/USD was in a steady downtrend, but sentiment data showed that short positions were declining even as price made new lows. This bullish divergence signaled that selling pressure was weakening. Price reversed sharply over the following sessions.
- Entry: 1.2650 (on reversal confirmation)
- Stop-loss: 1.2600 (below recent low)
- Take-profit: 1.2800 (next resistance level)
- Risk/Reward: ~1:3
7. Common Mistakes to Avoid
-
❌ Trading solely on sentiment
Sentiment should never be your only indicator. Always combine with technical and fundamental analysis. -
❌ Ignoring the trend context
Sentiment signals are strongest at trend extremes — not in the middle of a range. -
❌ Poor risk management
The future always contains uncertainty. Always use stop-losses and proper position sizing. -
❌ Chasing sentiment
Don’t enter just because sentiment is extreme — wait for price confirmation. -
❌ Not tracking changes
The direction of change in sentiment is often more important than the absolute level.
8. Forex Sentiment Analyzer — Interactive Tool
Use this interactive tool to instantly interpret sentiment data and get a contrarian trading signal. Enter the sentiment figures from your preferred source (IGCS, COT, or retail sentiment).
Forex Sentiment Analyzer
Enter the current sentiment data to get a trading signal based on the contrarian approach.
Signal
🔻 BEARISHStrength: Strong (75% Long)
Recommendation
SELL
Confidence: High
📋 Suggested Action
Consider short positions with stop-loss above resistance. Target next support level.
⚠️ Always use stop-loss and proper position sizing. Never rely on sentiment alone.
9. Frequently Asked Questions (FAQ)
What is sentiment analysis in forex?
Sentiment analysis in forex is the measurement of market participants’ overall attitude toward a currency pair. It tracks whether traders are predominantly bullish (optimistic) or bearish (pessimistic) and is often used as a contrarian indicator.
How do I use sentiment analysis in forex trading?
Use sentiment indicators like IG Client Sentiment (IGCS) or the COT report. Look for extremes (60%+ in one direction) as contrarian signals. Combine sentiment data with technical analysis for confirmation before entering trades.
What are the best sentiment indicators for forex?
The top sentiment indicators for forex are: (1) IG Client Sentiment (IGCS) — real-time retail trader data, (2) Commitment of Traders (COT) Report — weekly institutional positioning, (3) Fear & Greed Index — overall market sentiment.
Is sentiment analysis a leading or lagging indicator?
Sentiment analysis is generally considered a leading indicator. Changes in sentiment often precede price movements, making it valuable for anticipating reversals and breakouts.
Can I trade using only sentiment analysis?
No. Sentiment analysis works best when combined with technical analysis (support/resistance, trendlines, candlestick patterns) and fundamental analysis. Never rely on a single indicator.
What is the 60% rule in sentiment analysis?
The 60% rule states that when 60% or more of traders are positioned in one direction, it triggers a contrarian signal. When 80%+ are in one direction, it’s considered an extreme signal, indicating a strong potential reversal.
10. Conclusion
Sentiment analysis is a powerful addition to any forex trader’s arsenal. By tracking the psychology and positioning of market participants, you gain a real-time window into market psychology and can identify potential reversal points before they appear on the chart.
Key takeaways:
- ✅ Sentiment analysis measures whether traders are bullish or bearish
- ✅ It is a contrarian indicator — extremes (60%+) signal potential reversals
- ✅ Key indicators: IGCS, COT Report, Fear & Greed Index
- ✅ The direction of change (delta) is often more important than the absolute level
- ✅ Combine sentiment with technical analysis for the most reliable signals
- ✅ Use the Forex Sentiment Analyzer above to quickly interpret sentiment data
Want to learn more? Check out our other guides on Forex Basics and IG Client Sentiment Strategies.
Updated: June 2026
 Signal2forex.com - Best Forex robots and signals


