Rectangle Breakout Pattern — How to Trade This Powerful Forex Continuation Pattern (2026)
The rectangle breakout pattern is one of the most reliable continuation patterns in forex trading. It represents a pause in the trend — a period of consolidation — before price continues in the direction of the existing trend. This comprehensive guide covers bullish and bearish rectangle patterns, how to identify them, entry rules, stop-loss placement, price targets, and how to avoid false breakouts.
1. What Is a Rectangle Pattern in Forex?
The rectangle pattern is a continuation pattern that forms when price moves sideways between parallel support and resistance levels during a pause in an existing trend. It is one of the most frequently occurring patterns in forex trading and offers traders clear entry and exit levels with a favourable risk-to-reward ratio.
📌 Key Definition: A rectangle pattern is a consolidation phase where price is trapped between horizontal support and resistance. The pattern is complete when price breaks out of the range, typically in the direction of the pre-existing trend.
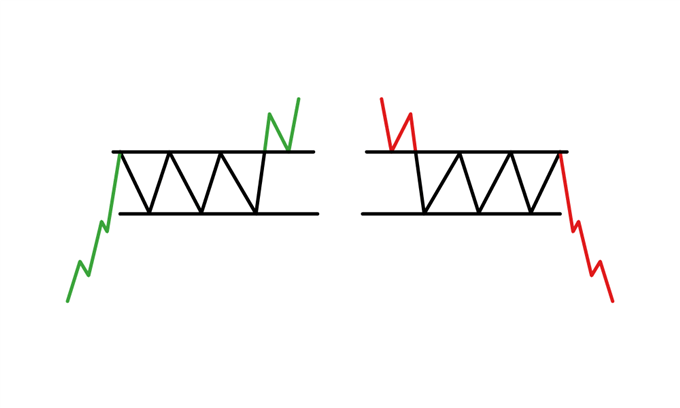
Fig 1: The rectangle pattern — price consolidates between parallel support and resistance levels.
Key Characteristics of the Rectangle Pattern
- Horizontal support and resistance — price bounces between two parallel levels
- Consolidation phase — price is in a range-bound state
- Pre-existing trend — the pattern forms during a pause in an uptrend or downtrend
- Breakout direction — price breaks out in the direction of the existing trend
- Volume confirmation — breakout volume is typically higher than during the consolidation
Rectangle as a Continuation Pattern
The rectangle pattern is primarily a continuation pattern. This means that the price is expected to continue in the direction of the existing trend after the consolidation phase ends. However, rectangles can occasionally signal reversals if the breakout occurs against the trend — but this is less common and requires additional confirmation.
2. Bullish vs Bearish Rectangle Patterns
Rectangle patterns can be bullish or bearish depending on the direction of the pre-existing trend and the breakout. Here is how they differ:
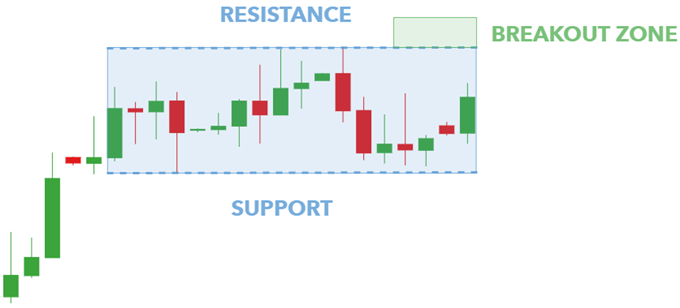
Fig 2: Bullish rectangle (left) and bearish rectangle (right) — continuation patterns in uptrends and downtrends.
Bullish Rectangle Pattern
A bullish rectangle pattern forms during an uptrend. It represents a temporary pause where price consolidates between horizontal support and resistance. Traders look to enter long positions when price breaks above resistance and closes inside the breakout zone.
- Trend: Uptrend
- Breakout Direction: Above resistance
- Action: Consider long positions
- Entry: Candle close above resistance
Bearish Rectangle Pattern
A bearish rectangle pattern forms during a downtrend. It represents a temporary pause where price consolidates between horizontal support and resistance. Traders look to enter short positions when price breaks below support and closes inside the breakout zone.
- Trend: Downtrend
- Breakout Direction: Below support
- Action: Consider short positions
- Entry: Candle close below support
💡 Pro Tip: The most reliable rectangle breakouts occur in the direction of the existing trend. Breakouts against the trend are less reliable and require stronger confirmation.
3. How to Identify a Rectangle Pattern on Forex Charts
Identifying a rectangle pattern involves more than simply drawing two horizontal lines. It requires an understanding of the broader trend context and confirmation from price action.
Identifying Support and Resistance Levels
- Identify the existing trend — confirm there is a clear uptrend or downtrend
- Look for consolidation — price should be moving sideways between two horizontal levels
- Draw the support line — connect at least two swing lows at the same price level
- Draw the resistance line — connect at least two swing highs at the same price level
- Confirm the rectangle — price should have tested both levels at least twice
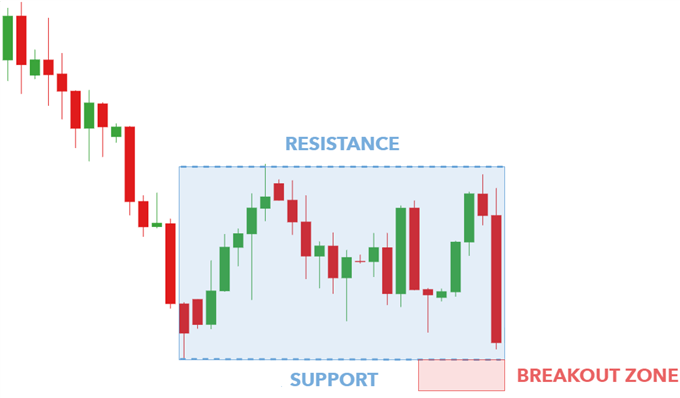
Fig 3: Drawing the rectangle — connecting swing highs and swing lows to identify the consolidation range.
Drawing the Rectangle Boundaries
- The upper boundary is the resistance level — the highest points price has reached during consolidation
- The lower boundary is the support level — the lowest points price has reached during consolidation
- The rectangle should be clearly defined with at least two touches on each side
Volume Confirmation
Volume is an important confirmation tool for rectangle patterns:
- During consolidation, volume should be below average as traders wait for a breakout
- During the breakout, volume should be above average to confirm the move
- If volume is low during the breakout, it may be a false breakout
4. Rectangle Breakout Trading Strategy
The rectangle breakout strategy is simple and effective. Here is a step-by-step guide to trading it:
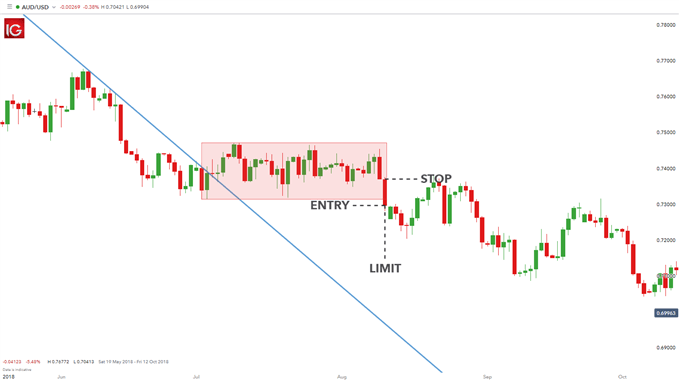
Fig 4: Rectangle breakout on AUD/USD — entry, stop-loss, and take-profit levels.
Entry Rules
- Bullish breakout: Enter long when a candle closes above resistance
- Bearish breakout: Enter short when a candle closes below support
- Alternative entry: Some traders wait for a pullback to the breakout level before entering
Stop-Loss Placement
- For long positions: Place stop-loss below the swing low of the rectangle
- For short positions: Place stop-loss above the swing high of the rectangle
- Alternative: Place stop-loss inside the rectangle for a tighter stop
Setting Price Targets
- Measure the height of the rectangle (distance between support and resistance)
- Project the height above resistance (for bullish breakouts) or below support (for bearish breakouts)
- Example: If the rectangle is 100 pips high, the target is 100 pips above resistance or below support
Risk-Reward Ratio
The rectangle pattern offers a favourable risk-to-reward ratio because the stop-loss is relatively tight (near the rectangle boundary) while the take-profit is based on the rectangle height (typically larger than the stop-loss distance).
- Minimum target: 1:2 risk-to-reward ratio
- Ideal target: 1:3 or higher
Real Example — AUD/USD Bearish Rectangle
- Trend: Downtrend confirmed by a blue trendline
- Rectangle formation: Red rectangle shows consolidation
- Entry: Candle close below support
- Stop-Loss: At the swing high of the rectangle
- Take-Profit: Rectangle height projected below support
⚠️ Important: Always confirm the breakout with volume and candle closure before entering. Never enter on an intraday break — wait for the candle to close.
5. Avoiding False Breakouts
False breakouts are one of the biggest challenges when trading rectangle patterns. A false breakout occurs when price temporarily breaks the support or resistance level but quickly reverses and re-enters the rectangle.
How to Spot a False Breakout
- Low volume — volume does not increase during the breakout
- Quick reversal — price returns inside the rectangle within 1-2 candles
- No follow-through — price fails to continue in the breakout direction
- Weak candle — the breakout candle has a long wick in the opposite direction
Confirmation Techniques
- Wait for the candle close — never enter on an intraday break
- Check volume — true breakouts have higher volume
- Use additional indicators — RSI, MACD, or moving averages for confirmation
- Watch for return to the range — if price returns quickly, it is a false breakout
- Check the overall trend — breakouts in the direction of the trend are more reliable
📌 Pro Tip: The safest way to avoid false breakouts is to wait for a pullback to the breakout level. If price breaks out and then pulls back to the support/resistance level without re-entering the rectangle, the breakout is confirmed.
6. Rectangle Pattern Reference Table
Use this reference table to quickly understand the differences between bullish and bearish rectangles, follow trading rules, and avoid false breakouts.
Part 1: Bullish vs Bearish Rectangle at a Glance
| Feature | Bullish Rectangle | Bearish Rectangle |
|---|---|---|
| Trend | Uptrend | Downtrend |
| Signal | Bullish continuation | Bearish continuation |
| Breakout Direction | Above resistance | Below support |
| Action | Consider long positions | Consider short positions |
| Entry | Candle close above resistance | Candle close below support |
Part 2: Rectangle Pattern Trading Rules Quick Reference
Part 3: Entry, Stop-Loss and Take-Profit Rules
| Element | Bullish Rectangle | Bearish Rectangle |
|---|---|---|
| Entry | Candle close above resistance | Candle close below support |
| Stop-Loss | Below the swing low | Above the swing high |
| Take-Profit | Rectangle height projected above resistance | Rectangle height projected below support |
| Risk/Reward | Aim for at least 1:2 | Aim for at least 1:2 |
Part 4: Avoiding False Breakouts — Checklist
Part 5: Advantages and Limitations
| Advantages ✅ | Limitations ❌ |
|---|---|
| Relatively simple to identify support and resistance | False breakouts can occur |
| Can be implemented in different markets | Requires patience to wait for the breakout |
| Simple concept for novice traders | Can be less reliable in choppy markets |
| Easy to set entry, stop and limit levels | Volume confirmation may not always be available |
7. Frequently Asked Questions (FAQ)
What is a rectangle pattern in forex?
A rectangle pattern is a continuation pattern that forms when price moves sideways between parallel support and resistance levels during a pause in an existing trend.
What is a bullish rectangle pattern?
A bullish rectangle pattern is a continuation pattern that occurs in an uptrend. Traders look to enter long positions when price breaks above resistance and closes inside the breakout zone.
What is a bearish rectangle pattern?
A bearish rectangle pattern is a continuation pattern that occurs in a downtrend. Traders look to enter short positions when price breaks below support and closes inside the breakout zone.
How do you trade a rectangle breakout?
Identify the pre-existing trend, establish support and resistance levels, wait for a candle close outside the range, enter at the candle close, set stop-loss at the swing high/low, and set take-profit by projecting the rectangle height.
Where do you place your stop-loss with a rectangle pattern?
Place your stop-loss at the candle swing high (for short positions) or at the candle swing low (for long positions).
How do you set a price target for a rectangle breakout?
Measure the height of the rectangle and project that height above resistance (for bullish breakouts) or below support (for bearish breakouts).
What is the difference between a rectangle and a triangle pattern?
A rectangle has parallel horizontal support and resistance levels, while a triangle has converging trendlines. Rectangles typically indicate continuation, while triangles can indicate continuation or reversal.
8. Need Help? Contact Us
Our support team is ready to assist you with any questions about rectangle patterns, breakout trading, or our forex products.
📌 Support Hours: Our team is available 24/5 via WhatsApp, Telegram, and Live Chat. We respond to all inquiries within 24 hours on business days.
9. Conclusion
The rectangle breakout pattern is a reliable and versatile continuation pattern that offers traders clear entry and exit levels with a favourable risk-to-reward ratio. By understanding the bullish and bearish versions, learning how to identify the pattern, and following strict trading rules, traders can significantly improve their ability to capture trend-continuation moves.
Key takeaways:
- ✅ The rectangle pattern is a continuation pattern that forms during a pause in an existing trend
- ✅ Bullish rectangles occur in uptrends, and traders enter on a break above resistance
- ✅ Bearish rectangles occur in downtrends, and traders enter on a break below support
- ✅ Entry: Wait for a candle close outside the range
- ✅ Stop-Loss: Place at the swing high/low of the rectangle
- ✅ Take-Profit: Project the rectangle height above resistance or below support
- ✅ Avoid false breakouts by waiting for candle closure, checking volume, and using confirmation
- ✅ Use the reference tables above for quick access to key information and trading checklists
📌 Final Advice: The rectangle pattern is a powerful tool for trend-following traders. To get the best results, practice on a demo account first, and always use proper risk management with a minimum 1:2 risk-to-reward ratio. The key to success with this pattern is patience and confirmation — wait for the breakout and confirm it before entering.
Continue your trading education — explore the guides below to deepen your understanding of breakout strategies and candlestick patterns.
Updated: July 2026
 Signal2forex.com - Best Forex robots and signals


