
📑 Table of Contents
- 1. What Is an Inverted Hammer Candlestick?
- 2. How to Identify an Inverted Hammer Pattern
- 3. Inverted Hammer Confirmation Signals
- 4. Inverted Hammer Trading Strategy
- 5. Inverted Hammer vs Other Reversal Patterns
- 6. Best Timeframes for Inverted Hammer Patterns
- 7. Inverted Hammer Success Rate and Reliability
- 8. Common Mistakes to Avoid
- 9. Frequently Asked Questions
1. What Is an Inverted Hammer Candlestick?
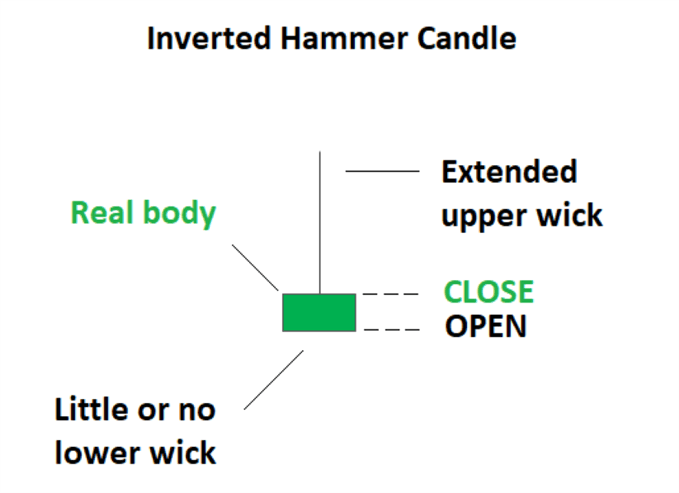
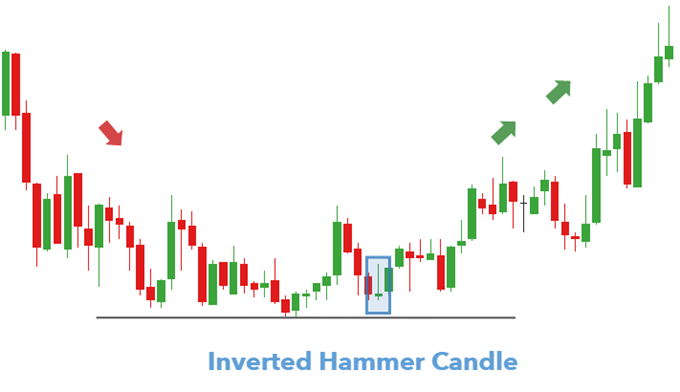
The inverted hammer is a single‑candle bullish reversal pattern that forms at the bottom of a downtrend. It has a small real body, a long upper wick (at least twice the length of the body), and little to no lower wick. This pattern signals that buyers attempted to push prices higher during the session, suggesting that selling pressure may be weakening and a reversal to the upside could be imminent.
The inverted hammer is the mirror image of the classic hammer — instead of a long lower wick, it has a long upper wick. Its name comes from its visual appearance: it looks like a hammer turned upside down, with the “handle” pointing upward.
2. How to Identify an Inverted Hammer Pattern
Identifying a valid inverted hammer requires more than just spotting a candle with a long upper wick. The context, preceding trend, and confirmation are all essential.
Key Characteristics
- Small real body — the difference between open and close is small
- Long upper wick — at least twice the length of the body
- Little to no lower wick — the low is very close to the close
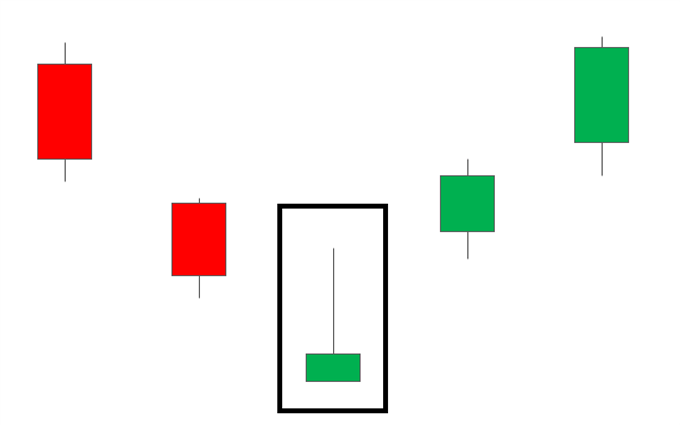
- Location — must appear at the end of a downtrend
- Colour — can be bullish (green/white) or bearish (red/black), though a bullish colour adds extra confirmation
Inverted Hammer vs Shooting Star
Both the inverted hammer and the shooting star have identical shapes — a small body with a long upper wick. The critical difference is location: the inverted hammer appears at the bottom of a downtrend (bullish reversal), while the shooting star appears at the top of an uptrend (bearish reversal).
Common Identification Mistakes
- Ignoring the trend — an inverted hammer in an uptrend is not a reversal signal; it is just a normal candle
- Not waiting for confirmation — entering immediately without confirmation is a common beginner mistake
- Confusing with a shooting star — always check the preceding trend
- Trading every inverted hammer — not every inverted hammer is a valid signal; focus on those that appear at key support levels or after a sharp drop
3. Inverted Hammer Confirmation Signals
Confirmation is essential when trading the inverted hammer. The pattern alone is not enough — you must wait for the next candle to confirm the reversal. The table below outlines the most reliable confirmation methods.
| Confirmation Method | Description | Reliability |
|---|---|---|
| Bullish Close Above High | Next candle closes above the inverted hammer’s high | High |
| Increased Volume | Higher volume on the confirming candle | High |
| Break Above Resistance | Price breaks above a nearby resistance level | High |
| Bullish Divergence | RSI or MACD shows bullish divergence | Medium-High |
| Support Level | Pattern forms at a key support level | Medium-High |
📌 Multiple confirmations increase the probability of a successful trade. The most reliable setup combines a bullish close above the high with increased volume.
4. Inverted Hammer Trading Strategy
Once you have identified a valid inverted hammer with confirmation, you can execute a trade using a structured approach. Here is a step‑by‑step strategy for trading this pattern.
Entry Points
- Aggressive entry — enter at the open of the candle after the confirmation candle closes
- Conservative entry — enter on a retest of the inverted hammer’s high or the confirmation candle’s high
- Breakout entry — enter when price breaks above the high of the inverted hammer or the confirmation candle
Stop‑Loss Placement
- Standard placement — place your stop‑loss just below the low of the inverted hammer’s body or the recent swing low
- Tight stop — place your stop‑loss below the confirmation candle’s low
- Wide stop — place your stop‑loss below the recent swing low for more breathing room
Profit Targets
- First target — the most recent swing high or resistance level
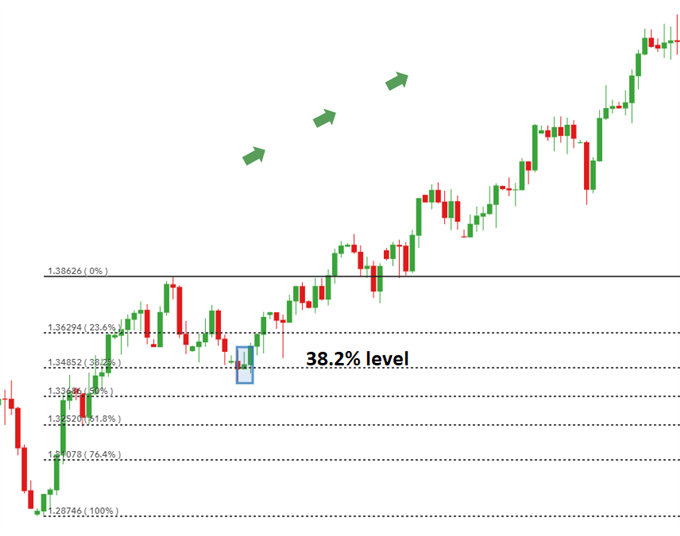
- Second target — the 61.8% Fibonacci retracement level of the preceding downtrend
- Extended target — the 100% Fibonacci retracement level (the start of the downtrend)
Combining with Other Indicators
The inverted hammer becomes more powerful when combined with other indicators:
- Inverted Hammer + RSI: Look for bullish divergence or oversold conditions
- Inverted Hammer + Moving Averages: Use moving averages to confirm the trend direction
- Inverted Hammer + Support/Resistance: Look for the pattern at key support levels
5. Inverted Hammer vs Other Reversal Patterns
The inverted hammer is just one of many bullish reversal patterns. The table below compares it with other common patterns to help you understand the differences and choose the right pattern for your trading style.
| Feature | Inverted Hammer | Hammer | Morning Star | Bullish Engulfing |
|---|---|---|---|---|
| Number of Candles | 1 | 1 | 3 | 2 |
| Location | Bottom of downtrend | Bottom of downtrend | Bottom of downtrend | Bottom of downtrend |
| Key Feature | Long upper wick | Long lower wick | Gap + large bullish candle | Bullish candle engulfs previous candle |
| Confirmation Needed | Yes (next candle) | Yes (next candle) | Yes (gap + candle) | Moderate |
| Reliability | Medium-High | High | Very High | High |
📌 The Morning Star is considered the most reliable due to its three‑candle confirmation structure. The inverted hammer is less reliable than the classic hammer but still a valuable tool when used with proper confirmation.
6. Best Timeframes for Inverted Hammer Patterns
The reliability of an inverted hammer pattern varies significantly depending on the timeframe you are trading. Higher timeframes produce fewer signals but carry greater significance.
| Timeframe | Reliability | Best Use | Signal Frequency |
|---|---|---|---|
| 1‑Minute | Low | Not recommended | Very High |
| 5‑Minute | Low-Medium | Scalping | High |
| 15‑Minute | Medium | Day trading | Medium-High |
| 1‑Hour | Medium-High | Swing trading | Medium |
| 4‑Hour | High | Swing trading | Low-Medium |
| Daily | Very High | Position trading | Low |
| Weekly | Very High | Long-term analysis | Very Low |
📌 Pro Tip: For swing trading, the 4‑hour and daily timeframes offer the best balance between reliability and signal frequency. Avoid lower timeframes unless you are a professional scalper.
7. Inverted Hammer Success Rate and Reliability
The inverted hammer pattern has a success rate of approximately 60–67% when traded with proper confirmation and risk management. However, this figure varies significantly based on the timeframe, market conditions, and the trader’s skill in identifying valid patterns.
Key factors that influence the success rate:
- Confirmation — patterns with a strong confirming candle have a significantly higher success rate
- Timeframe — higher timeframes (daily, weekly) produce more reliable signals
- Market context — patterns at key support levels or with bullish divergence are more reliable
- Volume — increased volume on the confirmation candle adds credibility to the signal
The inverted hammer is generally considered less reliable than the classic hammer, primarily because the long upper wick can be interpreted as selling pressure. However, when combined with proper confirmation and other technical tools, it remains a valuable pattern for identifying potential trend reversals.
8. Common Mistakes to Avoid
Even experienced traders make mistakes when trading the inverted hammer. Here are the most common pitfalls and how to avoid them.
- Trading Without Confirmation: The inverted hammer is a warning signal, not a trade signal. Always wait for the next candle to confirm the reversal.
- Ignoring the Trend: The inverted hammer must appear at the end of a downtrend. An inverted hammer in an uptrend is meaningless or could even be a bearish shooting star.
- Using the Wrong Timeframe: Lower timeframes produce many false signals. Stick to daily, 4‑hour, or higher timeframes for reliable signals.
- Placing Stops Too Tight: Placing your stop-loss too close to the pattern’s low increases the risk of being stopped out by normal market noise.
- Overlooking Volume: Low volume on the confirmation candle suggests weak conviction. Look for increased volume to validate the signal.
- Treating It as a Standalone Signal: No single pattern should be used in isolation. Combine the inverted hammer with other indicators like RSI, support/resistance, or moving averages.
9. Frequently Asked Questions
What is an inverted hammer candlestick pattern?
The inverted hammer is a single‑candle bullish reversal pattern that forms at the bottom of a downtrend. It has a small real body, a long upper wick (at least twice the body length), and little to no lower wick. It signals that buyers attempted to push prices higher, suggesting selling pressure may be weakening.
How do you identify an inverted hammer candle?
Look for a candle with a small real body near the session low, a long upper wick (at least 2x the body), and little or no lower wick. It must appear at the end of a downtrend. Always wait for confirmation from the next candle.
What is the difference between an inverted hammer and a shooting star?
Both candles look identical — small body and long upper wick. The difference is location: an inverted hammer forms at the bottom of a downtrend (bullish reversal), while a shooting star forms at the top of an uptrend (bearish reversal).
Do you need confirmation for an inverted hammer?
Yes. Always wait for the next candle to close higher (a strong bullish candle) or above the inverted hammer’s high before entering a trade. This confirmation significantly increases the probability of a successful reversal.
What is the success rate of the inverted hammer pattern?
The inverted hammer pattern has a success rate of approximately 60–67% when traded with proper confirmation and risk management. However, it is considered less reliable than the classic hammer.
Where should I place my stop‑loss when trading an inverted hammer?
Place your stop‑loss below the low of the inverted hammer’s body or the recent swing low. This level represents the point where selling pressure was strongest. A standard placement is 5‑10 pips below the pattern’s low.
What are the best timeframes for inverted hammer patterns?
Daily and weekly charts are generally considered more reliable than lower intraday timeframes. Higher timeframes produce fewer signals but carry greater significance due to broader market participation.
Can an inverted hammer be bearish?
No. The inverted hammer is strictly a bullish reversal pattern. The bearish version of the inverted hammer is called a shooting star, which appears at the top of an uptrend.
How can I confirm an inverted hammer signal?
Common confirmation methods include: a bullish candle closing above the inverted hammer’s high, increased volume on the confirming candle, a break above nearby resistance, or bullish divergence on RSI/MACD.
What is the psychology behind the inverted hammer?
The inverted hammer shows that buyers attempted to push prices higher during the session but were temporarily rejected. However, the fact that buyers tried at all during a downtrend suggests selling pressure is weakening and a reversal may be imminent.
Co to jest formacja odwróconego młota?
Odwrócony młot to jednokandlowa formacja odwrócenia hossy, która pojawia się na dole trendu spadkowego. Ma mały korpus, długi górny knot (co najmniej dwa razy dłuższy od korpusu) i mały lub żaden dolny knot. Sygnalizuje, że kupujący próbowali podnieść ceny, co sugeruje, że presja sprzedaży może słabnąć.
Jaka jest różnica między odwróconym młotem a spadającą gwiazdą?
Obie świece wyglądają identycznie — mały korpus i długi górny knot. Różnica polega na lokalizacji: odwrócony młot pojawia się na dole trendu spadkowego (sygnał hossy), podczas gdy spadająca gwiazda pojawia się na szczycie trendu wzrostowego (sygnał bessy).
📊 Explore Free Trading Resources: Visit our online shop to discover a wide range of free and premium trading tools, including Expert Advisors, trading indicators, and educational materials designed to enhance your technical analysis and candlestick trading strategies.
🤖 Automate Your Trading: For traders looking to implement systematic strategies, browse our complete collection of forex trading robots and Expert Advisors — fully automated systems designed to execute a variety of strategies, including reversal patterns like the inverted hammer. Our robots trade 24/7, eliminate emotional decision-making, and have been tested across multiple market conditions.



 Signal2forex.com - Best Forex robots and signals


