
📑 Table of Contents
- 1. What Is the 200 Day Moving Average?
- 2. How to Calculate the 200 Day Moving Average
- 3. How to Use the 200 Day Moving Average in Trading
- 4. Golden Cross vs Death Cross — What They Mean
- 5. 200 Day Moving Average Trading Strategies
- 6. 200 Day MA vs 50 Day MA vs 100 Day MA
- 7. Real Trading Examples
- 8. Common Mistakes When Using the 200 Day Moving Average
- 9. Frequently Asked Questions
1. What Is the 200 Day Moving Average?
The 200 day moving average is a technical indicator that calculates the average closing price of an asset over the last 200 trading days. It is one of the most widely followed indicators in forex, stock, and commodity trading, serving as a key benchmark for long-term trend identification.
The 200 day moving average is considered a major trend filter — when price is above the 200 MA, the market is generally considered to be in a long-term uptrend. When price is below the 200 MA, the market is considered to be in a long-term downtrend. This simple rule helps traders avoid trading against the dominant trend.
In addition to trend filtering, the 200 day MA often acts as dynamic support and resistance. In uptrends, price frequently bounces off the 200 MA; in downtrends, it often acts as a ceiling that price struggles to break through.

2. How to Calculate the 200 Day Moving Average
The calculation of the 200 day moving average is straightforward: add up the closing prices for each of the last 200 trading days and divide by 200.
Formula:
200 Day MA = (Price₁ + Price₂ + … + Price₂₀₀) / 200
Each new day creates a new data point — the oldest price is dropped, and the newest price is added. Connecting all the data points results in a continuous line on the chart that represents the average closing price over the past 200 days.
Most trading platforms (MetaTrader, TradingView, cTrader) calculate the 200 day moving average automatically. The indicator is typically found under “Moving Average” in the indicators menu.
3. How to Use the 200 Day Moving Average in Trading
The 200 day moving average can be used in three primary ways: as support and resistance, as a trend filter, and in crossover strategies with shorter-term moving averages.
Support and Resistance — Dynamic Levels
In an uptrend, the 200 day MA acts as dynamic support — price often pulls back to the 200 MA and then bounces higher. In a downtrend, it acts as dynamic resistance — price rallies to the 200 MA and then reverses lower.
Trend Filter — Trading in the Direction of the Trend
The simplest and most effective strategy is to trade only in the direction of the 200 day MA. If price is above the 200 MA, focus on long (buy) trades. If price is below the 200 MA, focus on short (sell) trades. This approach significantly increases your probability of success.
Moving Average Crossovers — Golden Cross and Death Cross
When the 50 day MA crosses the 200 day MA, it generates powerful signals. A Golden Cross (50 MA crossing above the 200 MA) is a bullish signal indicating a potential long-term uptrend. A Death Cross (50 MA crossing below the 200 MA) is a bearish signal indicating a potential long-term downtrend.

4. Golden Cross vs Death Cross — What They Mean
The Golden Cross and Death Cross are two of the most widely followed signals in technical analysis. They occur when the 50-day moving average crosses the 200-day moving average.
Golden Cross (Bullish): The 50-day MA crosses above the 200-day MA. This signals that short-term momentum is strengthening and a long-term uptrend may be beginning. It is considered a major buy signal.
Death Cross (Bearish): The 50-day MA crosses below the 200-day MA. This signals that short-term momentum is weakening and a long-term downtrend may be beginning. It is considered a major sell signal.
Both signals are more reliable when they occur after a prolonged trend and are confirmed by increasing volume. However, they are lagging indicators — by the time the crossover occurs, a significant move may have already happened.

5. 200 Day Moving Average Trading Strategies
Here are the most effective trading strategies using the 200 day moving average.
| Strategy | Description | Best Used For | Risk Level |
|---|---|---|---|
| Trend Filter | Trade only in direction of 200 MA | Long-term trend following | Low |
| Support/Resistance | Buy/sell on bounces off 200 MA | Trend continuation | Medium |
| Golden Cross | 50 MA crosses above 200 MA | Bullish reversal | Medium |
| Death Cross | 50 MA crosses below 200 MA | Bearish reversal | Medium |
| MA Crossover | Multiple MAs (21, 55, 100, 200) | Trend strength analysis | Low-Medium |
📌 Choose a strategy that matches your trading style and risk tolerance. The Trend Filter is the most conservative approach.
6. 200 Day MA vs 50 Day MA vs 100 Day MA
Understanding the differences between these three moving averages helps you choose the right one for your trading strategy.
| Feature | 50 Day MA | 100 Day MA | 200 Day MA |
|---|---|---|---|
| Timeframe | Medium-term | Medium-long term | Long-term |
| Sensitivity | High | Medium | Low |
| Best Used For | Trend confirmation | Trend confirmation | Major trend identification |
| Signal Type | Entry/Exit timing | Trend confirmation | Major trend filter |
| Reliability | Moderate | High | Very High |
📌 The 200 day MA is the most reliable for identifying the primary trend. The 50 day MA is more sensitive to recent price changes.
7. Real Trading Examples
EUR/USD — Bounce Off the 200 Day MA
In a strong uptrend, EUR/USD pulled back to the 200 day MA at 1.0850. The price formed a bullish engulfing pattern at this level, and the RSI was in oversold territory (below 30). Traders entered long positions at 1.0860, with a stop-loss below the 200 MA at 1.0800. Price rallied to 1.1000, delivering a 140-pip profit with a risk of 60 pips — a risk-reward ratio of approximately 1:2.3.
GBP/USD — Moving Average Crossover Signals
GBP/USD had been in a downtrend, with the 21, 55, 100, and 200 day moving averages stacked bearishly (shorter-term MAs below longer-term MAs). When the 21 MA crossed above the 55 MA, it signaled a potential trend change. Traders waited for the 55 MA to cross above the 200 MA before entering long positions. This multi-MA approach provided a high-confidence entry signal.
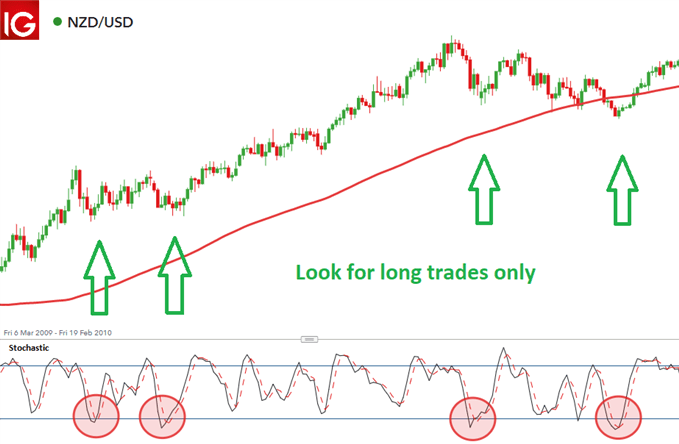
NZD/USD — Trend Filter Strategy
NZD/USD was trading above the 200 day MA, indicating a long-term uptrend. Traders focused exclusively on long positions, using pullbacks to the 50 MA as entry opportunities. The stochastic oscillator was used to confirm oversold conditions before entering. This approach resulted in consistent profits with minimal drawdown.
8. Common Mistakes When Using the 200 Day Moving Average
Avoid these common pitfalls to improve your results with the 200 day moving average.
- ❌ Using it in isolation: The 200 day MA should be combined with other indicators like RSI, MACD, and volume analysis for best results.
- ❌ Trading against the trend: Trading against the direction of the 200 day MA significantly reduces your probability of success.
- ❌ Entering too early: Waiting for price to confirm its reaction to the 200 MA (e.g., a bullish candle close above the MA) improves entry timing.
- ❌ Ignoring the Golden Cross and Death Cross: These crossovers provide some of the most powerful long-term signals in technical analysis.
- ❌ Using it on lower timeframes: The 200 day MA is designed for daily charts. Using it on lower timeframes (e.g., H1) reduces its significance.
- ❌ Not adjusting stop-losses: As the 200 MA moves, trailing stops should be adjusted to lock in profits while giving the trade room to run.
9. Frequently Asked Questions
What is the 200 day moving average?
The 200 day moving average is a technical indicator that calculates the average closing price of an asset over the last 200 trading days. It is widely used to identify long-term trends and is considered a key level of support and resistance in forex and stock trading.
How do you calculate the 200 day moving average?
Add up the closing prices for each of the last 200 days and divide by 200. Each new day creates a new data point, and connecting all the data points results in a continuous line on the chart.
What is the Golden Cross in trading?
A Golden Cross occurs when the 50-day moving average crosses above the 200-day moving average. This is considered a bullish signal indicating a potential long-term uptrend.
What is the Death Cross in trading?
A Death Cross occurs when the 50-day moving average crosses below the 200-day moving average. This is considered a bearish signal indicating a potential long-term downtrend.
How do you use the 200 day moving average as support and resistance?
In an uptrend, the 200 day MA acts as dynamic support — price often bounces off it and continues higher. In a downtrend, it acts as dynamic resistance — price often bounces off it and continues lower.
What is the best strategy with the 200 day moving average?
The trend filter strategy is one of the most popular — trade only in the direction of the 200 day MA. If price is above the 200 MA, look for long entries. If price is below, look for short entries.
What is the difference between the 50 day, 100 day, and 200 day moving averages?
The 50 day MA is more sensitive to recent price changes and is used for medium-term signals. The 200 day MA is less sensitive and is used for long-term trend identification. The 100 day MA falls in between.
Is the 200 day moving average reliable in forex trading?
Yes, the 200 day moving average is widely used in forex trading and is considered reliable for identifying long-term trends. However, it should not be used in isolation — always combine with other indicators and proper risk management.
What is the 200 day moving average crossover strategy?
The crossover strategy involves using multiple moving averages (e.g., 50, 100, and 200 day). When shorter-term MAs cross above or below the 200 day MA, it generates buy or sell signals.
🌍 Expand your trading opportunities: Learn how to trade the top 5 emerging market currencies — how to trade them. Understanding how the 200 day moving average works on major pairs is essential, but applying it to emerging market currencies like the Mexican Peso, Russian Ruble, and Indian Rupee can unlock even greater opportunities in 2026.
🤖 Automate your 200 day MA strategy: Download our free Moving Average Expert Advisor (EA) for MT4 — a powerful automated trading tool that combines ATR, SMA, EMA, WMA, and TEMA to generate high-probability signals. Perfect for traders who want to automate their moving average strategies.
📞 Need help with your 200 day moving average strategy? Our team is here to assist you. Visit our Contact Page or use the online chat available on every page of our website for immediate support.



 Signal2forex.com - Best Forex robots and signals


