📑 Table of Contents
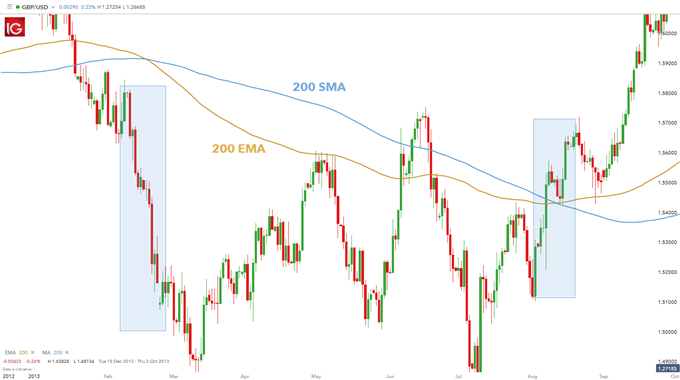
1. What Is the EMA (Exponential Moving Average) Indicator?
The Exponential Moving Average (EMA) is a technical indicator that calculates the average price of an asset over a specific number of periods, giving more weight to recent price data. This weighting makes the EMA more responsive to short-term price fluctuations than a Simple Moving Average (SMA), making it a preferred tool for traders who need to react quickly to market changes.
Unlike the SMA, which assigns equal weight to all data points, the EMA uses a smoothing factor (or multiplier) that prioritises the most recent prices. This means the EMA reacts faster to new information, providing earlier signals for trend changes and potential entry or exit points. It is widely used in forex, stock, and commodity trading for trend identification, dynamic support/resistance, and crossover strategies.
Key characteristics of the EMA:
- Responsive — reacts quickly to price changes
- Lagging — still lags behind price, but less than SMA
- Dynamic — acts as dynamic support/resistance in strong trends
- Versatile — can be used for any timeframe or market
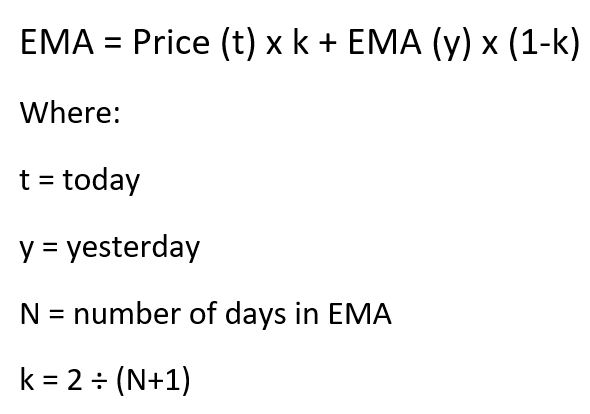
2. How to Calculate the Exponential Moving Average
The calculation of the EMA is slightly more complex than the SMA, but understanding the formula is essential for interpreting the indicator correctly.
The EMA Formula
The formula for the EMA is:
EMA = (Closing Price — Previous EMA) × Multiplier + Previous EMA
Where the Multiplier (also called the smoothing factor) is:
Multiplier = 2 ÷ (Number of Periods + 1)
Step-by-Step Calculation Example
Let us calculate a 5‑period EMA for a hypothetical asset with the following closing prices:
- Day 1: $50.00
- Day 2: $51.00
- Day 3: $52.00
- Day 4: $53.00
- Day 5: $54.00
Step 1 — Calculate the SMA for the initial period (Day 1–5):
SMA = ($50 + $51 + $52 + $53 + $54) ÷ 5 = $52.00
Step 2 — Calculate the Multiplier:
Multiplier = 2 ÷ (5 + 1) = 2 ÷ 6 = 0.3333 (or 33.33%)
Step 3 — Apply the EMA formula for Day 6 (assuming closing price of $56.00):
EMA = ($56.00 — $52.00) × 0.3333 + $52.00 = $4.00 × 0.3333 + $52.00 = $1.33 + $52.00 = $53.33
Notice how the EMA gives more weight to the latest price ($56.00), pulling the average higher than the SMA would. This responsiveness is what makes the EMA so valuable for traders who need to capture momentum early.
3. EMA vs SMA — Key Differences
Both the EMA and SMA are moving averages, but they have distinct characteristics that make them suitable for different trading styles and market conditions.
| Feature | EMA (Exponential MA) | SMA (Simple MA) |
|---|---|---|
| Weighting | More weight on recent prices | Equal weight on all prices |
| Reactivity | Fast — responds quickly to price changes | Slow — smoother, less responsive |
| Best Use | Short-term trading, momentum, scalping | Long-term trends, filtering noise |
| Lag | Less lag | More lag |
| Whipsaw | More prone to false signals | Less prone to whipsaw |
| Common Periods | 9, 12, 20, 50, 200 | 50, 100, 200 |
| Calculation | Uses smoothing multiplier K=2/(N+1) | Simple average of closing prices |
📌 The EMA is better for short-term momentum trading, while the SMA is preferred for identifying long-term trend direction and filtering out noise.
4. How to Use the EMA Indicator in Trading
The EMA is a versatile tool that can be used in several ways to improve your trading decisions. Here are the most common applications.
Identifying Market Trends
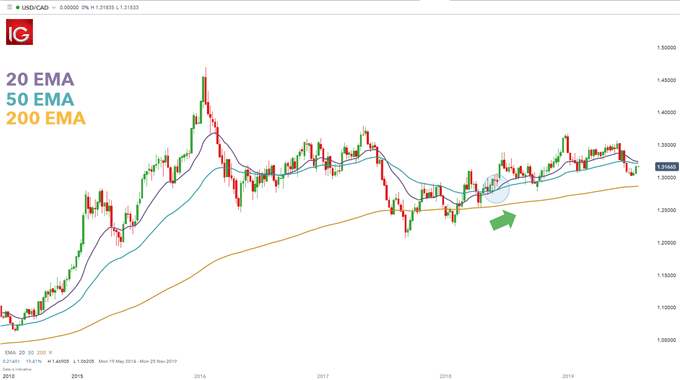
The most basic use of the EMA is to determine the direction of the trend. When price is above a rising EMA, the trend is considered bullish. When price is below a falling EMA, the trend is bearish. The 50‑period and 200‑period EMAs are commonly used for this purpose.
EMA as Dynamic Support and Resistance
In strong trends, the EMA often acts as dynamic support (in an uptrend) or dynamic resistance (in a downtrend). Price frequently bounces off the EMA before continuing in the trend direction. This makes the EMA a useful level for placing stop‑losses or identifying pullback entry points.
EMA Crossover Strategies
EMA crossovers are among the most popular trading strategies. When a short‑term EMA (e.g., 9‑period) crosses above a longer‑term EMA (e.g., 21‑period), it generates a buy signal. When it crosses below, it generates a sell signal. Crossovers of the 50‑period and 200‑period EMAs are known as the Golden Cross (bullish) and Death Cross (bearish).
5. Best EMA Settings for Different Timeframes
The optimal EMA period depends on your trading timeframe and style. The table below provides recommended settings for various timeframes.
| Timeframe | Short-Term EMA | Medium-Term EMA | Long-Term EMA | Best Use |
|---|---|---|---|---|
| 1-Minute | 9 | 21 | 50 | Scalping |
| 5-Minute | 9 | 21 | 50 | Intraday scalping |
| 15-Minute | 12 | 26 | 50 | Day trading |
| 1-Hour | 20 | 50 | 200 | Swing trading |
| 4-Hour | 20 | 50 | 200 | Swing trading |
| Daily | 20 | 50 | 200 | Position trading |
| Weekly | 20 | 50 | 200 | Long-term analysis |
📌 These are general guidelines. Always test and adjust EMA settings based on the specific market and asset you are trading.
6. EMA Trading Strategies
There are several effective ways to incorporate the EMA into your trading strategy. Here are four of the most popular approaches.
Golden Cross and Death Cross
The Golden Cross occurs when the 50‑period EMA crosses above the 200‑period EMA, signalling a potential long‑term bull market. The Death Cross occurs when the 50‑period EMA crosses below the 200‑period EMA, signalling a potential long‑term bear market. These are among the most widely followed signals in technical analysis.
EMA Pullback Strategy
In a strong trend, price often pulls back to the EMA before continuing in the trend direction. Traders can wait for price to touch the EMA and look for a confirmation signal (such as a bullish or bearish candlestick pattern) before entering a trade in the direction of the trend. This strategy works best with the 50‑period or 200‑period EMA on daily or 4‑hour charts.
Multi-EMA Trend Confirmation
Using multiple EMAs (e.g., 9, 21, and 50) can help confirm trend strength. When all three EMAs are aligned in the same direction (short > medium > long for bullish, or short < medium < long for bearish), it confirms a strong trend. This alignment is often referred to as a stacked EMA configuration.
EMA + Price Action Confirmation
For higher probability trades, combine EMA signals with price action. For example, if price is above a rising 50‑period EMA and forms a bullish engulfing pattern or pin bar at the EMA, it provides a strong buy signal. This approach reduces the number of false signals and improves entry timing.
7. Common EMA Mistakes and Solutions
Even experienced traders make mistakes when using the EMA. Avoid these common pitfalls to improve your trading results.
| Mistake | Why It’s Harmful | How to Fix |
|---|---|---|
| Using EMA as a standalone signal | EMA is a lagging indicator; can give false signals | Combine with price action and other indicators |
| Buying/selling just because price touches EMA | Price often touches EMA without reversing | Wait for price action confirmation (candlestick patterns) |
| Using wrong EMA period | Too short = whipsaw; too long = too laggy | Match EMA period to your trading timeframe |
| Ignoring higher timeframe context | Can trade against the bigger trend | Always check higher timeframe EMA alignment |
| Not adjusting EMA periods for volatility | Fixed periods don’t work in all market conditions | Consider using adaptive or multiple EMAs |
📌 The key to successful EMA trading is not the indicator itself — it is how you use it in conjunction with other tools and proper risk management.
8. Frequently Asked Questions
What is the EMA indicator?
The EMA (Exponential Moving Average) is a technical indicator that gives more weight to recent price data, making it more responsive to short-term market fluctuations than a Simple Moving Average (SMA).
How is the EMA calculated?
The EMA formula is: EMA = (Closing Price — Previous EMA) × Multiplier + Previous EMA, where Multiplier = 2 ÷ (Number of Periods + 1).
What is the difference between EMA and SMA?
EMA gives more weight to recent prices, making it more reactive to price changes. SMA gives equal weight to all data points, making it smoother and slower.
What are the best EMA settings for forex?
Common settings include: 9‑period and 21‑period for short-term trading, 50‑period for trend direction, and 200‑period for the long-term trend.
What is an EMA crossover strategy?
When a short-term EMA (e.g., 9‑period) crosses above a long-term EMA (e.g., 50‑period), it generates a buy signal. A cross below generates a sell signal.
What is the Golden Cross?
The Golden Cross occurs when the 50‑period EMA crosses above the 200‑period EMA, signalling a potential long-term bull market.
What is the Death Cross?
The Death Cross occurs when the 50‑period EMA crosses below the 200‑period EMA, signalling a potential long-term bear market.
Can I use EMA for day trading?
Yes. Short-term EMAs like 9, 12, or 20 periods are commonly used for day trading and scalping to capture quick price movements.
How does EMA work as support and resistance?
In strong trends, the EMA often acts as dynamic support (bullish) or resistance (bearish). Price frequently bounces off the EMA before continuing in the trend direction.
What is the 50 EMA used for?
The 50 EMA is widely used to identify trend direction and find dynamic support/resistance levels. Price above a rising 50 EMA indicates a bullish trend; price below a falling 50 EMA indicates a bearish trend.
📊 Let Professionals Trade for You: If you want to implement EMA strategies without the stress of manual execution, consider our Forex Account Management Service (First Month FREE 2026). Our professionals trade on your behalf using advanced algorithms — so you can benefit from expert execution without emotional interference.
🤖 Automate Your EMA Trading: The Forex V Portfolio Robot for 14 Currency Pairs (2026) is an award‑winning Expert Advisor that uses a sophisticated algorithm combining multiple indicators — including EMAs — to identify high‑probability trades with 50‑300% monthly profit and low drawdown, removing emotional decisions from your trading.
 Signal2forex.com - Best Forex robots and signals


