Very few patterns clearly illustrate the reversal in market direction like the double bottom pattern. The double bottom fashions itself at the end of a downtrend creating potential long entries for buyers.
Double Bottom Patterns: Main Talking Points:
- What is a double bottom?
- How to identify a double bottom pattern on charts
- Using the double bottom pattern in trading
- Learn more about trading with technical patterns
What is a double bottom?
The double bottom pattern entails two low points forming near a similar horizontal price level and signifies a potential bullish reversal signal. A measured strengthening in price will occur between the two low points showing some support at the price lows.
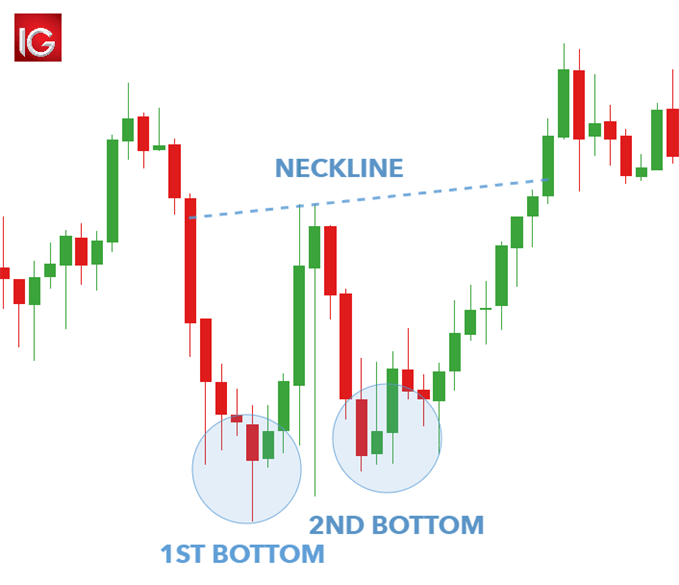
The double bottom chart pattern is found at the end of a downtrend and resembles the letter “W”(see chart below). Price falls to a new low and then rallies slightly higher before returning to the new low. Unable to push price to a new lower low to continue the downtrend, sellers give up and price bounces sharply from this area.The bullish confirmation is specified by a break in the key price level situated at the high point between the ‘bottoms’ resistance level (neckline).
Similarly, the double top pattern reciprocates the double bottom pattern signaling a bearish reversal. Instead of the confirmation being shown at a break in the key resistance level, the double top occurs at the key support lows between the two high points. The double bottom and double top patterns are powerful technical tools used by traders in major financial markets including forex.
How to identify a double bottom pattern
Step-by-step guide to identifying the double bottom pattern on a chart:
- Identify the two distinct bottoms of similar width and height
- Distance between bottoms should not be too small – time frame dependent
- Confirm neckline/resistance price level
- Use other technical indicators to support double bottom bullish signal such as moving averages and oscillators
- Be wary of trading against strong trends
Trading with a double bottom pattern: forex and stocks
The double bottom is frequently used in the forex and equity markets as buy/bullish signals. The charts below show how this pattern is utilized in both markets.
NZD/USD Double Bottom Chart Pattern
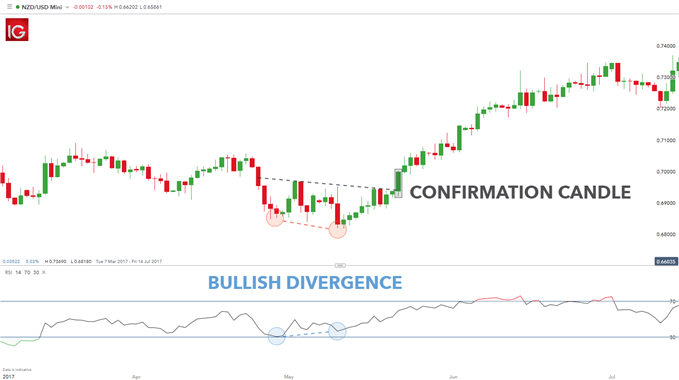
The chart above displays a double bottom pattern after a mild downtrend. Used in conjunction with a technical oscillator (RSI), the trader has further support by the bullish divergence signaling a potential reversal of the preceding downtrend. The stop level is set by taking the low from the two ‘bottoms’. From this level traders can use the 1:2 risk-reward ratio to provide a limit level or use price action by locating a key level.
Entering the trade requires waiting for a confirmation candle to close above the neckline. This technique is viewed as more risk averse but greater probability of a positive trade although risk-reward is far less.
Apple Inc Double Bottom Chart Pattern
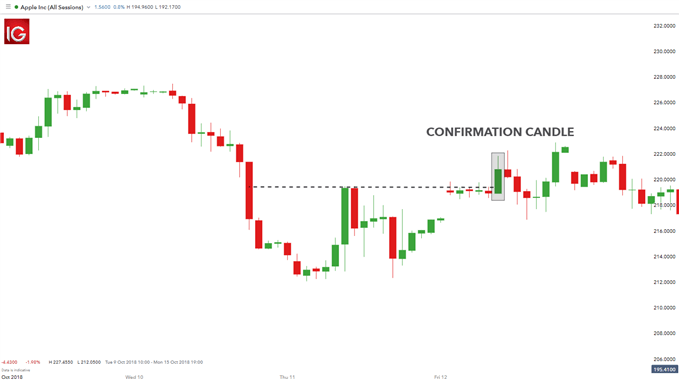
The chart above shows a double bottom pattern on an Apple Inc chart. The identification and appearance of the double bottom is the same for both forex and equity markets. This example shows the neckline break confirmation entry signal whereby the price closes above the neckline which will then indicate a long entry. The highlighted candle in the image above clearly closes above the neckline after some resistance, indicating a stronger push by bulls to push the price up.
It is important to note that trading against a strong downward trend should be approached with caution even with a double bottom formation. Convincing supporting factors should be aligned and confirmed before entering the market. Even with these factors, proper risk management is essential in any trade to avoid excessive losses.
 Signal2forex.com - Best Forex robots and signals


