
Bollinger Bands in Forex — Complete Guide & Strategies (2026)
Bollinger Bands are one of the most versatile and widely used technical indicators in forex trading. They measure market volatility and help traders identify overbought and oversold conditions, trend strength, and potential breakout opportunities. This comprehensive guide covers what Bollinger Bands are, how they work, the best settings, and proven trading strategies — with real chart examples and a full reference table.
1. What Are Bollinger Bands and How Do They Work?
Bollinger Bands are a volatility-based technical indicator developed by John Bollinger in the 1980s. They consist of three lines plotted on a price chart: a middle band (a simple moving average), an upper band, and a lower band. The upper and lower bands are placed at a specified number of standard deviations above and below the middle band.
📌 Key Definition: Bollinger Bands are a volatility indicator consisting of an upper band, a lower band, and a 20-period Simple Moving Average (SMA). The bands are placed at two standard deviations above and below the moving average, containing approximately 95% of price data within the bands.
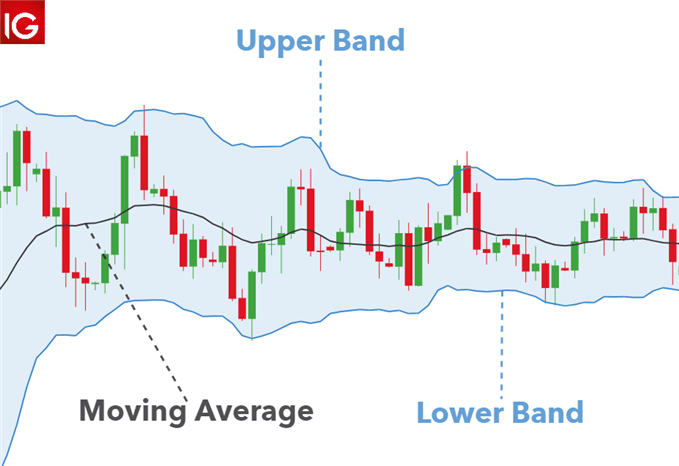
Fig 1: Bollinger Bands structure — upper band, middle band (20 SMA), and lower band.
The Three Components of Bollinger Bands
| Component | Description | Significance |
|---|---|---|
| Upper Band | 2 standard deviations above the 20-period SMA | Overbought zone — price touching the upper band may indicate a potential reversal or continuation |
| Middle Band | 20-period Simple Moving Average (SMA) | The baseline — often used as dynamic support/resistance and trend direction indicator |
| Lower Band | 2 standard deviations below the 20-period SMA | Oversold zone — price touching the lower band may indicate a potential reversal or continuation |
The Standard Deviation and Volatility Connection
Standard deviation is a statistical measure of volatility. When the market is highly volatile, standard deviation increases, and the bands expand. When volatility is low, standard deviation decreases, and the bands contract. This dynamic nature makes Bollinger Bands self-adjusting to changing market conditions.
- Bands expanding — increasing volatility, potential for large price moves
- Bands contracting — decreasing volatility, potential for a breakout (Bollinger Squeeze)
- Price touching the upper band — often indicates overbought conditions
- Price touching the lower band — often indicates oversold conditions
What Do Bollinger Bands Tell Traders?
- Volatility levels — expansion and contraction of the bands indicate changes in market volatility
- Overbought and oversold conditions — price near the upper band may be overbought; price near the lower band may be oversold
- Trend strength — when price consistently walks the upper or lower band, the trend is strong
- Potential breakouts — a Bollinger Squeeze (band contraction) often precedes a significant price move
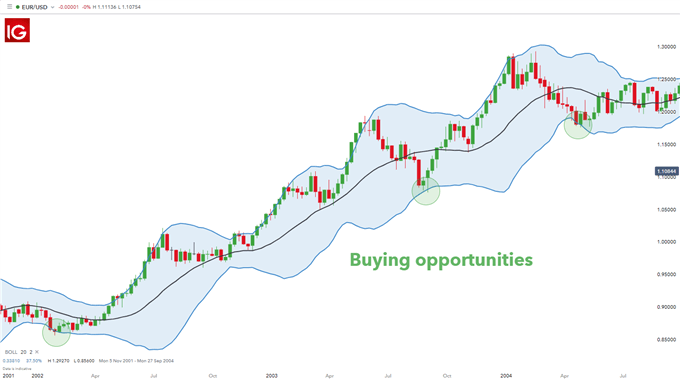
Fig 2: Bollinger Bands expansion and contraction — volatility changes in action.
2. Best Bollinger Band Settings for Forex Trading
The default setting for Bollinger Bands is (20, 2) — a 20-period SMA with 2 standard deviations. However, different trading styles and timeframes may require adjustments to optimise performance.
| Trading Style | Period | Standard Deviation | Timeframe | Best For |
|---|---|---|---|---|
| Scalping | 10-14 | 2.0 | 1-min, 5-min | Quick entries and exits |
| Day Trading | 20 | 2.0 | 15-min, 1-hour | Trend following, squeezes |
| Swing Trading | 20 | 2.0 | 4-hour, Daily | Trend and reversal trading |
| Position Trading | 50 | 2.5 | Daily, Weekly | Long-term trend identification |
📌 Pro Tip: The default setting (20, 2) works well for most traders. If you are trading highly volatile pairs like GBP/JPY, consider increasing the standard deviation to 2.2-2.5. For less volatile pairs like EUR/USD, the default 2.0 is usually sufficient.

Fig 3: Bollinger Bands settings comparison — different periods and standard deviations.
3. Bollinger Band Forex Trading Strategies
There are four main strategies for trading with Bollinger Bands in forex. Each strategy is suited to different market conditions and trading styles.
Strategy 1 — Trading the Trend with Bollinger Bands
This strategy works best in trending markets when price consistently moves in one direction.
- Setup: Identify the trend — higher highs and higher lows for an uptrend; lower highs and lower lows for a downtrend
- Entry: In an uptrend, enter long when price touches the lower band (dynamic support). In a downtrend, enter short when price touches the upper band (dynamic resistance)
- Stop-Loss: Place beyond the band
- Take-Profit: Target the opposite band or use a trailing stop
Strategy 2 — The Bollinger Band Squeeze
The Bollinger Squeeze occurs when the bands contract significantly, indicating low volatility and a potential breakout.
- Setup: Look for the bands to narrow (squeeze) — this often happens before major news events
- Entry: Wait for price to break above the upper band (long) or below the lower band (short) with a strong candle
- Stop-Loss: Place inside the squeeze (near the middle band)
- Take-Profit: Target the middle band (SMA) or use a trailing stop
Strategy 3 — Reversal Trading with Bollinger Bands
This strategy is based on the idea that when price touches the upper or lower band, it may reverse direction.
- Setup: Price touches the upper band in an uptrend (potential bearish reversal) or the lower band in a downtrend (potential bullish reversal)
- Entry: Wait for a confirmation candle (e.g., pin bar, engulfing pattern) before entering
- Stop-Loss: Place beyond the band
- Take-Profit: Target the opposite band or the middle band
Strategy 4 — Combining Bollinger Bands with Other Indicators
Combining Bollinger Bands with other indicators can significantly improve the reliability of signals.
- Bollinger Bands + RSI — confirm overbought/oversold conditions (RSI above 70 or below 30)
- Bollinger Bands + MACD — confirm momentum (MACD histogram direction)
- Bollinger Bands + Volume — confirm breakout strength (volume spikes on breakout)
💡 Pro Tip: The Bollinger Squeeze is one of the most reliable setups. When you see the bands contracting significantly, prepare for a potential breakout — and combine with volume or momentum indicators for confirmation.
4. Bollinger Bands — Advantages and Limitations
Like any technical indicator, Bollinger Bands have their strengths and weaknesses. Understanding both will help you use them more effectively.
Advantages ✅
- Works on all timeframes and assets — from 1-minute to weekly charts; applicable to forex, stocks, commodities, and crypto
- Adapts to changing volatility — the bands automatically expand and contract based on market volatility
- Provides objective support/resistance levels — the upper and lower bands offer clear, measurable levels
- Combines well with other indicators — works effectively with RSI, MACD, and volume
- Versatile — can be used for trend following, breakout trading, and reversal trading
Limitations ❌
- Lagging indicator — based on a moving average, so it reacts to price changes with a slight delay
- False signals — price touching the upper band does not always mean a reversal (price can «walk the band» in strong trends)
- Less effective in strong trends — when a trend is very strong, price can consistently walk along the upper or lower band, creating false reversal signals
- Requires confirmation — signals should be confirmed with other indicators or price action
⚠️ Important: In strong trends, price can «walk the band» — meaning it will consistently follow the upper or lower band without reversing. In these conditions, reversal signals from Bollinger Bands are less reliable. Always check the trend context before entering a trade.
5. Bollinger Bands Reference Table
Use this reference table to quickly understand key terms, compare settings, and follow trading rules.
Part 1: Key Terms & Definitions
Part 2: Bollinger Band Settings Comparison
| Trading Style | Period | Std Dev | Timeframe | Best For |
|---|---|---|---|---|
| Scalping | 10-14 | 2.0 | 1-min, 5-min | Quick entries and exits |
| Day Trading | 20 | 2.0 | 15-min, 1-hour | Trend following, squeezes |
| Swing Trading | 20 | 2.0 | 4-hour, Daily | Trend and reversal trading |
| Position Trading | 50 | 2.5 | Daily, Weekly | Long-term trend identification |
Part 3: Trading Strategies Quick Reference
| Strategy | Setup | Entry | Stop-Loss | Take-Profit |
|---|---|---|---|---|
| Trend Trading | Identify trend (higher highs/lows) | Price touches lower band (long) or upper band (short) | Beyond the band | Opposite band |
| Bollinger Squeeze | Bands contracting (low volatility) | Breakout above/below band | Inside the squeeze | Middle band (SMA) |
| Reversal Trading | Price touches band + confirmation | On confirmation candle | Beyond the band | Opposite band |
| Combined Strategy | BB + RSI/MACD confirmation | BB signal + indicator confirmation | Beyond the band | Opposite band or trail |
Part 4: Advantages and Limitations
| Advantages ✅ | Limitations ❌ |
|---|---|
| Works on all timeframes and assets | Lagging indicator |
| Adapts to changing volatility | False signals — band touches don’t always mean reversals |
| Provides objective support/resistance levels | Less effective in strong trends |
| Combines well with other indicators | Requires confirmation from other tools |
Part 5: Quick Trading Checklist
6. Frequently Asked Questions (FAQ)
What are Bollinger Bands in forex?
Bollinger Bands are a volatility indicator consisting of an upper band, lower band, and a 20-period moving average. The bands are placed at two standard deviations above and below the moving average, containing approximately 95% of price data.
What is the best setting for Bollinger Bands in forex?
The default setting is (20, 2) — a 20-period moving average with 2 standard deviations. For scalping, traders often use (10-14, 2); for position trading, (50, 2.5) is common.
How do you trade with Bollinger Bands in forex?
Common strategies include: (1) Trading the trend — enter when price touches the lower band in an uptrend; (2) Bollinger Squeeze — enter on breakout after bands contract; (3) Reversal trading — look for band touches with confirmation.
What is a Bollinger Band squeeze?
A Bollinger squeeze occurs when the bands contract significantly, indicating low volatility. This often precedes a strong breakout, and traders look to enter on the breakout above or below the bands.
Are Bollinger Bands a leading or lagging indicator?
Bollinger Bands are a lagging indicator because they are based on a moving average. However, they provide leading information about volatility through the expansion and contraction of the bands.
Can Bollinger Bands be used for scalping?
Yes, Bollinger Bands can be used for scalping with shorter periods (10-14) and tighter timeframes (1-min, 5-min). They help identify overbought/oversold conditions and potential breakouts.
What is the difference between Bollinger Bands and Keltner Channels?
Bollinger Bands use standard deviation to measure volatility, while Keltner Channels use Average True Range (ATR). Bollinger Bands are more responsive to volatility changes; Keltner Channels are smoother.
7. Need Help? Contact Us
Our support team is ready to assist you with any questions about Bollinger Bands, trading strategies, or our forex products.
📌 Support Hours: Our team is available 24/5 via WhatsApp, Telegram, and Live Chat. We respond to all inquiries within 24 hours on business days.
8. Conclusion
Bollinger Bands are one of the most versatile and powerful technical indicators available to forex traders. By measuring volatility and providing dynamic support and resistance levels, they help traders identify trends, breakouts, and reversals with greater confidence.
Key takeaways:
- ✅ Bollinger Bands consist of three components: upper band, middle band (20 SMA), and lower band
- ✅ The default setting is (20, 2) — adjust based on your trading style and timeframe
- ✅ Four main strategies: Trend Trading, Bollinger Squeeze, Reversal Trading, and Combined Strategies
- ✅ Advantages: works on all timeframes, adapts to volatility, provides clear levels
- ✅ Limitations: lagging indicator, false signals in strong trends, requires confirmation
- ✅ Use the reference tables above for quick access to key information and trading checklists
📌 Final Advice: Bollinger Bands are a valuable addition to any trader’s toolkit. To get the best results, practice on a demo account first, and always use proper risk management with a minimum 1:2 risk-to-reward ratio. The key to success with this indicator is context and confirmation — use it in the right market conditions and confirm signals with other tools.
Continue your trading education — explore the guides below to deepen your understanding of forex trading.
Updated: July 2026



 Signal2forex.com - Best Forex robots and signals


