
📑 Table of Contents
- 1. What Is the Cup and Handle Pattern?
- 2. How to Identify a Valid Cup and Handle Pattern
- 3. Cup and Handle Pattern Trading Strategy
- 4. Cup and Handle Pattern Variations
- 5. Psychology Behind the Cup and Handle Pattern
- 6. Cup and Handle vs Other Chart Patterns
- 7. Common Mistakes to Avoid
- 8. Frequently Asked Questions
1. What Is the Cup and Handle Pattern?
The cup and handle pattern is a bullish continuation pattern that signals a potential breakout to new highs following a period of consolidation. Developed by legendary trader William O’Neil in his 1988 book “How to Make Money in Stocks,” this pattern remains one of the most reliable chart formations in technical analysis.
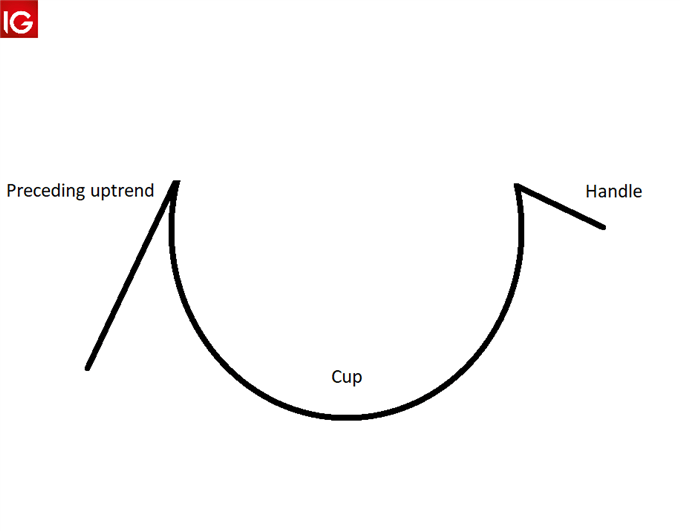
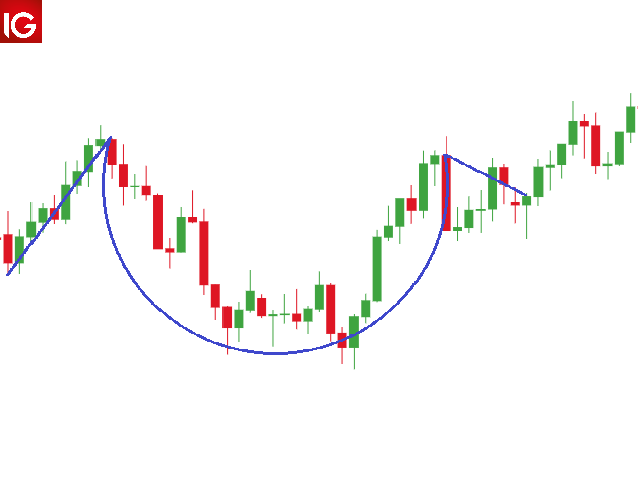
The pattern consists of two distinct parts: a rounded bottom (the “cup”) that resembles a “U” shape, followed by a brief consolidation (the “handle”) that slopes downward. When the price breaks above the handle’s resistance level, it typically signals the resumption of the prior uptrend.
The cup and handle pattern is considered a continuation pattern, meaning it occurs during an existing uptrend and signals that the trend is likely to continue after a brief pause. It is one of the few patterns that provides both a clear entry signal and a measurable price target.
2. How to Identify a Valid Cup and Handle Pattern
Identifying a valid cup and handle pattern requires careful attention to several key criteria. Not every rounded bottom followed by a pullback qualifies as a genuine cup and handle formation.
The Cup Formation (U-Shaped Base)
The cup should form a “U” shape, not a sharp “V” shape. A U-shaped bottom indicates orderly accumulation and selling exhaustion, while a V-shaped bottom suggests panic buying rather than patient accumulation. The left and right sides of the cup should be roughly equal in height, with the highs on either side forming a resistance level.
The cup should form over a period of several weeks to several months. Longer cups tend to produce more powerful breakouts. The depth of the cup typically ranges from 12% to 35% of the prior high, with shallower cups being more reliable.
The Handle Formation (Consolidation Phase)
The handle forms in the upper half of the cup — ideally in the top 25% to 50% of the cup’s depth. If the handle drops below the midpoint of the cup, the pattern is generally considered invalid. The handle should be a downward-sloping consolidation that lasts 1 to 4 weeks, though it can sometimes consolidate sideways.
The handle’s depth should be 10% to 33% of the cup’s depth. Deeper handles indicate weaker support and increase the risk of pattern failure. The handle represents the “shaking out” of weak holders before the final breakout.
Volume Confirmation
Volume is a critical confirming factor for the cup and handle pattern. During the cup formation, volume should decline as the price moves toward the bottom, indicating selling exhaustion. During the handle, volume should contract further, showing that sellers are running out of steam.
The breakout above the handle’s resistance must be accompanied by a sharp increase in volume — ideally 50% or more above the average volume. This surge confirms that institutional buyers are stepping in and that the breakout is genuine.
3. Cup and Handle Pattern Trading Strategy
Trading the cup and handle pattern requires a disciplined approach to entry, stop-loss placement, and profit targets. The table below outlines the key elements of a complete trading strategy.
| Element | Action | Rationale |
|---|---|---|
| Entry | Buy on close of breakout candle above handle resistance, or place buy-stop order just above resistance | Confirms breakout with price action; reduces false breakout risk |
| Confirmation | Volume surge 50%+ above average on breakout day | Institutional buying confirms genuine breakout |
| Stop-Loss | Place stop-loss below the handle’s low (3–5% below in equities; under swing low in forex) | Invalidates pattern if breached; protects against false breakouts |
| Target 1 | Measure cup depth from rim to bottom; add to breakout point | Measured move target based on pattern’s size |
| Target 2 | Trail stop under higher lows after first target is reached | Captures extended runs in strong trends |
| Risk-Reward | Minimum 1:2, ideally 1:3 or higher | Ensures positive expectancy over multiple trades |
📌 The cup and handle pattern works across all timeframes, but daily and weekly charts provide the most reliable signals.
Entry Points
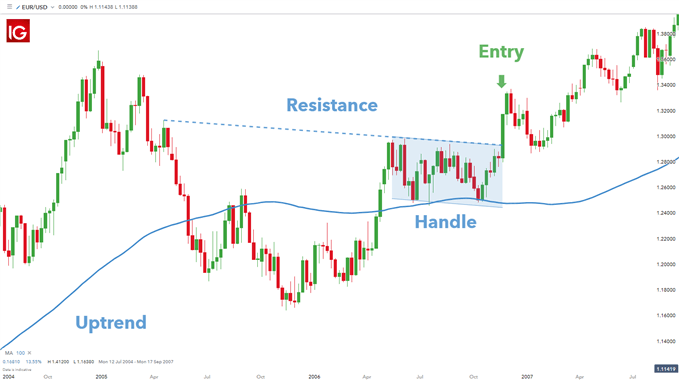
There are two primary entry methods for the cup and handle pattern. The first is to enter on the break of the handle’s resistance level, buying when the price closes above this level with strong volume. The second is to use a buy-stop order placed just above the handle’s high, which triggers automatically when the price breaks out.
Price Target Calculation
The most common method for calculating a price target is the measured move. Measure the depth of the cup from the rim high to the cup bottom, then add that distance to the breakout point. For example, if the cup rim is at $150 and the bottom is at $120 (depth of $30), the target is $150 + $30 = $180.
Position Sizing and Risk Management
Position sizing should be based on the distance from your entry to your stop-loss. A common rule is to risk no more than 1% to 2% of your trading capital on any single trade. This ensures that even a series of losing trades will not significantly damage your account.

4. Cup and Handle Pattern Variations
While the classic cup and handle is a bullish continuation pattern, there are several variations that traders should be aware of.
Inverted Cup and Handle (Bearish)
The inverted cup and handle is the bearish counterpart of the classic pattern. It forms during a downtrend and signals a continuation of the bearish move. The pattern consists of an upside-down “U” shape (the inverted cup) followed by an upward-sloping handle. The breakdown below the handle’s support confirms the bearish signal.
This pattern is less common than the bullish version but can be equally powerful when identified correctly. The same rules apply: the inverted cup should be rounded, the handle should form in the lower half, and volume should increase on the breakdown.
Cup and “Odd” Handle
Sometimes the handle does not form a clean downward slope but instead consolidates sideways in a rectangle pattern. While less ideal, these formations can still be valid if the other criteria are met. The key is that the handle must occur in the upper half of the cup and must show decreasing volume.
Short Cup and Handle
Some formations develop over a shorter period — several weeks rather than several months. These “short cups” can still be valid but tend to produce smaller moves. The same identification rules apply, but traders should be more cautious and look for stronger volume confirmation.
5. Psychology Behind the Cup and Handle Pattern
Understanding the psychology behind the cup and handle pattern can significantly improve your ability to trade it effectively. Each phase of the pattern reflects distinct market sentiment and trader behaviour.
The Cup Phase: Accumulation and Exhaustion
During the left side of the cup, the price declines as sellers dominate. As the price approaches the bottom, selling pressure begins to wane — reflected in declining volume. At the bottom of the cup, buyers gradually step in, creating the rounded “U” shape. This phase represents patient accumulation by institutional investors who are willing to wait for the right entry.
The Handle Phase: Shaking Out the Weak Hands
As the price approaches the previous high, some traders who bought near the top may look to exit at breakeven. This selling pressure creates the handle. The handle’s downward slope reflects weak holders being shaken out before the final breakout. The contracting volume during this phase indicates that selling pressure is drying up.
The Breakout Phase: FOMO and Momentum
When the price breaks above the handle’s resistance with a surge in volume, it triggers a wave of buying from momentum traders and institutions that were waiting on the sidelines. This creates a self-reinforcing cycle of buying pressure that drives the price toward the measured move target.
6. Cup and Handle vs Other Chart Patterns
The cup and handle pattern is often compared to other chart patterns. The table below highlights the key differences.
| Feature | Cup and Handle | Double Bottom | Head and Shoulders | Flag/Pennant |
|---|---|---|---|---|
| Type | Bullish Continuation | Bullish Reversal | Bearish Reversal | Bullish Continuation |
| Timeframe | Weeks to months | Weeks to months | Weeks to months | Days to weeks |
| Shape | U-shaped cup + handle | Two distinct lows | Three peaks (left, head, right) | Rectangular/triangular |
| Volume Pattern | Low in cup, surge on breakout | Low between bottoms | High on left, low on right | Low during consolidation |
| Target Calculation | Cup depth from breakout | Distance between bottoms | Neckline to head height | Flagpole height |
| Best Market | All markets | All markets | All markets | Trending markets |
📌 The cup and handle is unique in requiring a rounded bottom and a specific handle formation, making it one of the more distinctive chart patterns.
7. Common Mistakes to Avoid
Even experienced traders make mistakes when trading the cup and handle pattern. Here are the most common pitfalls and how to avoid them.
- Treating V-Shaped Bottoms as Valid Cups: A sharp “V” bottom indicates panic selling or panic buying, not orderly accumulation. Always look for a rounded “U” shape.
- Entering Without Volume Confirmation: A breakout on low volume has a high failure rate. Always wait for a volume surge of 50%+ above average before entering.
- Ignoring the Prior Trend Context: The cup and handle is a continuation pattern. If there is no clear prior uptrend, the pattern is invalid.
- Placing Stops Too Tight: Placing your stop-loss too close to the handle’s low increases the risk of being stopped out by normal market noise. Give the trade room to breathe.
- Trading Handles in the Lower Half of the Cup: If the handle drops below the midpoint of the cup, the pattern is generally invalid. Wait for a handle in the upper half.
- Failing to Adjust Targets in Strong Trends: In powerful trends, price can exceed the measured move target. Use trailing stops to capture extended runs.
8. Frequently Asked Questions
What is a cup and handle pattern?
The cup and handle is a bullish continuation pattern that forms when a security consolidates in a rounded trough (the “cup”) followed by a brief pullback (the “handle”) before breaking out to new highs. It was developed by William O’Neil in 1988.
How do you identify a cup and handle pattern?
Look for a prior uptrend, a rounded U-shaped cup (not V-shaped), a handle in the upper half of the cup with depth of 10–33% of the cup, and volume contraction during formation followed by a surge on breakout.
What is the cup and handle pattern price target?
Measure the depth of the cup (from the rim high to the cup bottom) and add that distance to the breakout point. For example, if the cup depth is $30, add $30 to the breakout price.
What is the difference between cup and handle and double bottom?
The cup and handle is a continuation pattern that appears during uptrends, while the double bottom is a reversal pattern. The cup and handle has a rounded bottom and a handle consolidation, whereas the double bottom has two distinct lows.
What is the inverted cup and handle pattern?
The inverted cup and handle is a bearish continuation pattern that appears during downtrends. It forms an upside-down “U” followed by an upward-sloping handle before breaking lower.
What is the best timeframe for cup and handle pattern?
Daily and weekly charts provide the most reliable signals. The pattern typically forms over several weeks to months, though shorter formations of a few weeks also exist.
Where should I place my stop-loss when trading cup and handle?
Place your stop-loss below the handle’s low. In equities, this is typically 3–5% below; in forex, just under the handle’s swing low. If price revisits that level, the breakout thesis is invalid.
What is the role of volume in cup and handle pattern?
Volume should contract during the cup formation and handle, then expand sharply on the breakout (ideally 50%+ above average). A breakout on thin volume has a higher failure rate.
What are common mistakes when trading cup and handle?
Common mistakes include: treating V-shaped bottoms as valid cups, entering without volume confirmation, placing stops too tight, ignoring the prior trend context, and trading handles that form in the lower half of the cup.
Can cup and handle be used in forex trading?
Yes, the cup and handle pattern works well in forex markets. The pattern’s characteristics align well with currency trading, and it can be applied across all major currency pairs.
🤖 Automate Your Cup and Handle Strategy: For traders looking to implement systematic trading around chart patterns, explore our collection of forex trading robots and Expert Advisors — fully automated systems designed to execute a variety of strategies, including breakout trading and pattern recognition. With over 14 proven EAs available, you can find the perfect automated solution to complement your cup and handle analysis. Our robots trade 24/7, eliminate emotional decision-making, and have been tested across multiple market conditions.
📊 Professional Account Management: If you prefer a hands-off approach to trading, explore our forex account management service — professional traders will manage your account using proven strategies, including pattern-based trading and risk-managed approaches. This service is ideal for traders who want to benefit from professional expertise without spending hours analyzing charts and managing positions themselves.



 Signal2forex.com - Best Forex robots and signals


