
📑 Table of Contents
- 1. What Is the Bollinger Bands and MACD Combination?
- 2. Bollinger Bands and MACD — How They Complement Each Other
- 3. Strategy 1: Bollinger Band Breakout Strategy with MACD
- 4. Strategy 2: Trend Trading with Bollinger Bands and MACD
- 5. Strategy Comparison Table
- 6. Advantages and Limitations
- 7. Best Settings for Bollinger Bands and MACD
- 8. Common Mistakes When Using Bollinger Bands and MACD
- 9. Bollinger Bands and MACD Reference Table
- 10. Frequently Asked Questions
1. What Is the Bollinger Bands and MACD Combination?
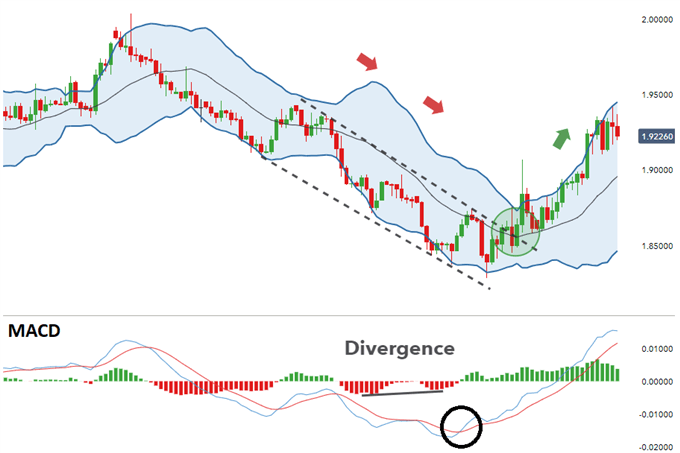
The Bollinger Bands and MACD strategy is one of the most powerful combinations in technical analysis. By combining volatility measurement (Bollinger Bands) with momentum and trend analysis (MACD), traders can identify high-probability breakout and trend-following setups.
This combination works because Bollinger Bands and MACD measure different but complementary aspects of price action: Bollinger Bands gauge volatility and potential breakout levels, while MACD confirms whether the move has momentum behind it. When used together, they filter out false signals and significantly improve win rates.
2. Bollinger Bands and MACD — How They Complement Each Other
Bollinger Bands — The Volatility Gauge
Bollinger Bands consist of a middle band (20-period SMA) and two outer bands (two standard deviations above and below the middle band). They expand during high volatility and contract during low volatility. The bands serve as dynamic support and resistance levels, and they help identify overextended price moves and potential breakout levels.
MACD — The Momentum and Trend Indicator
The MACD (Moving Average Convergence Divergence) consists of the MACD line (fast EMA minus slow EMA), the signal line (EMA of the MACD line), and the histogram. It measures momentum and trend strength. Key signals include line crossovers, histogram changes, and divergence with price.
Why This Combination Is Powerful for Forex Trading
When Bollinger Bands signal a potential breakout (price touching or crossing the outer band) and MACD confirms the move with strong momentum (crossover or divergence), the probability of a successful trade increases significantly. The combination allows traders to:
- Reduce false signals — Bollinger Bands identify the volatility context, MACD confirms the momentum
- Improve entry timing — wait for both indicators to align
- Trade with the trend — use MACD to confirm the trend direction, Bollinger Bands to find entry levels
3. Strategy 1: Bollinger Band Breakout Strategy with MACD
This strategy focuses on identifying breakouts after periods of low volatility (band squeeze). When the bands contract significantly, it often precedes a strong price move. The MACD confirms the breakout direction and momentum.
Step-by-Step Setup
- Identify the squeeze — Bollinger Bands contract significantly (width narrows)
- Wait for the breakout — price closes above the upper band (bullish) or below the lower band (bearish)
- Check MACD confirmation — ensure the MACD line has crossed the signal line in the breakout direction
- Enter the trade — enter on the close above/below the band
- Set stop-loss — below the lower band (bullish) or above the upper band (bearish)
- Set take-profit — measured move or previous significant levels
Entry, Stop-Loss and Take-Profit Rules
| Component | Bullish Breakout | Bearish Breakout |
|---|---|---|
| Entry Signal | Price closes above upper band + MACD bullish crossover | Price closes below lower band + MACD bearish crossover |
| Stop-Loss | Below the lower band | Above the upper band |
| Take-Profit | Measured move (band width) or previous resistance | Measured move (band width) or previous support |
| Best Timeframe | 1-hour to 4-hour charts | 1-hour to 4-hour charts |
Real Chart Example
A classic example would be EUR/USD on the 4-hour chart. After a period of low volatility where the Bollinger Bands contracted, price broke above the upper band with a strong bullish candle. The MACD confirmed the move with a bullish crossover and rising histogram. The trade continued for over 100 pips before hitting the measured move target.

4. Strategy 2: Trend Trading with Bollinger Bands and MACD
This strategy is designed for trending markets where price consistently respects the middle Bollinger Band (20-period SMA) as dynamic support or resistance. The MACD confirms the trend direction and momentum.
Step-by-Step Setup
- Identify the trend — price above the middle band (bullish) or below (bearish)
- Wait for a pullback — price retraces to the middle band
- Check MACD confirmation — ensure MACD line is above signal line (bullish) or below (bearish)
- Enter the trade — enter on a bullish reversal signal at the middle band (bullish) or bearish reversal (bearish)
- Set stop-loss — below the lower band (bullish) or above the upper band (bearish)
- Set take-profit — previous highs/lows or the opposite band
Entry, Stop-Loss and Take-Profit Rules
| Component | Bullish Trend | Bearish Trend |
|---|---|---|
| Entry Signal | Price bounces off middle band + MACD above signal line | Price rejected at middle band + MACD below signal line |
| Stop-Loss | Below the lower band | Above the upper band |
| Take-Profit | Previous high or the upper band | Previous low or the lower band |
| Best Timeframe | 1-hour to daily charts | 1-hour to daily charts |
Pro Tips for Strong Trends
- Look for stacked MACD — when the MACD line and signal line are both moving in the same direction, the trend is strong
- Avoid counter-trend trades — only trade in the direction of the MACD
- Use multiple timeframes — confirm the trend on a higher timeframe before entering
5. Bollinger Bands and MACD Strategy Comparison
Both strategies are effective, but they work best in different market conditions. The table below helps you choose the right approach.
| Feature | Breakout Strategy | Trend Trading Strategy |
|---|---|---|
| Market Condition | Ranging then breaking out | Trending strongly |
| Entry Signal | Break of upper/lower band | Bounce off middle band |
| MACD Role | Divergence or crossover confirmation | Trend and momentum confirmation |
| Bollinger Bands Role | Identify breakout via band breach | Identify pullback level (middle band) |
| Stop-Loss | Below lower / above upper band | Below lower / above upper band |
| Take-Profit | Measured move / significant levels | Significant S/R levels |
| Best Timeframe | 1-hour to 4-hour | 1-hour to daily |
| Risk Level | Medium-High | Low-Medium |
6. Advantages and Limitations
Like any trading approach, the Bollinger Bands and MACD strategy has its strengths and weaknesses.
| Advantages | Limitations |
|---|---|
| Complementary signals — combines volatility and momentum | Lagging indicators — both are based on historical data |
| Versatile — works on all timeframes | False signals in choppy markets — can generate whipsaws |
| Clear entry rules — easy to follow | Requires confirmation — not a standalone system |
| Risk management — defined stop-loss levels | Can miss strong trends — if relying only on breakouts |
| Widely used — proven over time | May need adjustment — settings may vary by pair |
7. Best Settings for Bollinger Bands and MACD
While the default settings work well for most traders, adjusting them based on your timeframe can improve performance.
| Timeframe | Bollinger Bands Settings | MACD Settings | Best Use |
|---|---|---|---|
| 1-Minute | 20, 2.0 | 12, 26, 9 | Scalping |
| 5-Minute | 20, 2.0 | 12, 26, 9 | Scalping |
| 15-Minute | 20, 2.0 | 12, 26, 9 | Day trading |
| 1-Hour | 20, 2.0 | 12, 26, 9 | Swing trading |
| 4-Hour | 20, 2.0 | 12, 26, 9 | Swing trading |
| Daily | 20, 2.0 | 12, 26, 9 | Position trading |
📌 Standard settings (20, 2.0 for Bollinger Bands and 12, 26, 9 for MACD) work across all timeframes. Adjustments should be based on backtesting and the specific currency pair.
8. Common Mistakes When Using Bollinger Bands and MACD
Even experienced traders make mistakes with this combination. Avoid these common pitfalls.
| Mistake | Why It’s Harmful | How to Fix |
|---|---|---|
| Ignoring divergence | Misses early reversal signals | Always check MACD divergence before entry |
| Using in choppy markets | Generates false signals | Only use in trending or breakout conditions |
| Setting tight stops inside bands | Stopped out by normal volatility | Place stops outside the bands |
| Trading every band touch | Too many false signals | Wait for MACD confirmation |
| Ignoring band squeeze | Misses potential breakouts | Watch for squeeze as early warning |
9. Bollinger Bands and MACD Reference Table
This quick reference table summarises key terms and their meanings for the Bollinger Bands and MACD combination.
| Term | Meaning | Trading Implication |
|---|---|---|
| Bollinger Band Squeeze | Bands contract significantly (low volatility) | Potential breakout brewing — prepare for a move |
| Walking the Band | Price consistently moves along the upper or lower band | Strong trend — use band as trailing stop |
| MACD Crossover | MACD line crosses above or below the signal line | Momentum shift — potential entry signal |
| MACD Divergence | Price and MACD move in opposite directions | Potential reversal — act with caution |
| MACD Histogram | Difference between MACD line and signal line | Increasing histogram = strengthening momentum |
| Bollinger Band Width | Distance between upper and lower bands | Width expansion = increasing volatility |
10. Frequently Asked Questions
What is the Bollinger Bands and MACD strategy?
The Bollinger Bands and MACD strategy combines volatility measurement (Bollinger Bands) with momentum and trend analysis (MACD) to identify high-probability breakout and trend-following setups. The combination helps filter out false signals and improves win rates.
How do you use Bollinger Bands and MACD together?
Use Bollinger Bands to identify volatility conditions and potential breakout levels. Use MACD to confirm the momentum and direction of the move. When both indicators align, the probability of a successful trade increases significantly.
What is the Bollinger Band breakout strategy with MACD?
This strategy involves identifying a Bollinger Band squeeze (low volatility), waiting for price to break above the upper band or below the lower band, and confirming the breakout with a MACD crossover. The stop-loss is placed outside the bands and the take-profit is based on a measured move.
What is the trend trading strategy with Bollinger Bands and MACD?
This strategy involves identifying a strong trend (price above the middle band for bullish or below for bearish), waiting for a pullback to the middle band, and confirming the trend continuation with the MACD. The stop-loss is placed beyond the outer band and the take-profit at significant support/resistance levels.
What are the advantages of using Bollinger Bands and MACD together?
Combining these indicators provides complementary signals (volatility + momentum), reduces false signals, offers clear entry and exit rules, and works across all timeframes and markets.
What are the limitations of this strategy?
Both indicators are lagging, can generate false signals in choppy markets, require confirmation, and may miss strong trends if relying only on breakouts. Adjusting settings based on the currency pair and timeframe is recommended.
Is this strategy suitable for beginners?
Yes, the strategy is suitable for beginners because it has clear entry, stop-loss, and take-profit rules. However, beginners should practice on a demo account first and start with lower timeframe charts like 1-hour or 4-hour before moving to shorter timeframes.
What is the best timeframe for the Bollinger Bands and MACD strategy?
The strategy works on all timeframes. The breakout strategy performs best during high-volatility periods like the London-New York overlap, while the trend trading strategy works well on 1-hour and 4-hour charts for swing trading.
What are the best settings for Bollinger Bands and MACD?
Standard settings work well: Bollinger Bands (20 periods, 2 standard deviations) and MACD (12, 26, 9). These settings are optimal for most forex pairs and timeframes.
How do you identify a Bollinger Band squeeze with MACD?
A Bollinger Band squeeze occurs when the bands contract significantly, indicating low volatility. When combined with MACD momentum, a squeeze often precedes a strong breakout. Watch for the bands to narrow and MACD to show building momentum.
Can this strategy be used for scalping?
Yes, the strategy can be adapted for scalping using lower timeframes (1-minute or 5-minute). However, spreads and commissions should be considered, and the strategy requires quick execution.
What is MACD divergence and how do you spot it?
MACD divergence occurs when price makes a new high or low but the MACD indicator does not confirm it. Bullish divergence (price lower low, MACD higher low) signals potential reversal up. Bearish divergence (price higher high, MACD lower high) signals potential reversal down.
How do Bollinger Bands and MACD reduce false signals?
Bollinger Bands identify the volatility context, while MACD confirms whether the move has momentum. A breakout without MACD confirmation is more likely to be a false signal. Using both indicators filters out low-probability setups.
What is “walking the band” and how do you trade it?
“Walking the band” occurs when price consistently moves along the upper or lower Bollinger Band, indicating a strong trend. In this situation, traders can use the band as a trailing stop and ride the trend with MACD confirmation.
Is this strategy profitable in forex?
Yes, the Bollinger Bands and MACD strategy is widely used by professional forex traders. Profitability depends on proper execution, risk management, and adapting the strategy to current market conditions.
📊 Let Professionals Trade This Strategy for You: If you want to benefit from the Bollinger Bands and MACD strategy without the stress of manual execution, consider our Forex Account Management Service (First Month FREE 2026). Our professionals trade on your behalf using advanced algorithms — so you can benefit from expert execution without emotional interference.
🤖 Automate Your Bollinger Bands and MACD Trading: The Forex V Portfolio Robot for 14 Currency Pairs (2026) is an award‑winning Expert Advisor that uses a sophisticated algorithm combining multiple indicators — including Bollinger Bands and MACD — to identify high‑probability trades with 50‑300% monthly profit and low drawdown, removing emotional decisions from your trading.



 Signal2forex.com - Best Forex robots and signals


