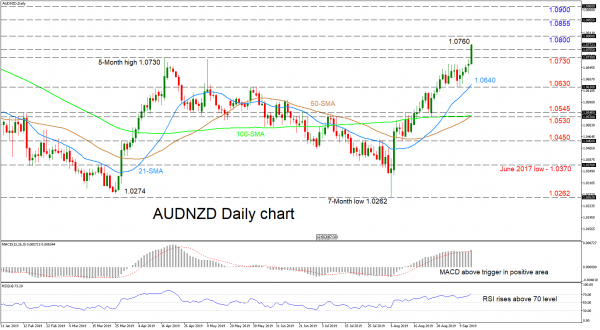
AUDNZD breached the five-month high from April 17, after plotting gains in a rally that commenced on August 6.
The indicators are reflecting an increase in positive directional momentum. The MACD has re-inclined above its red trigger line in the positive region, while the upward sloping RSI crosses into overbought territory. Further endorsing the view, the 21-day simple moving average (SMA) has distanced itself above the 50-day SMA, while the 50-day SMA itself approaches a bullish cross of the 100-day SMA.
If the bulls manage to ascend through 1.0755, the price could jump to re-test the 1.0800 resistance coming from the inside swing low from October 31. Conquering 1.0800, the rally could stretch up to the 1.0855 resistance from September 3, while slightly higher 1.0900 could be of psychological importance.
Should the bears dominate, the price could initially slip to test the 1.0730 barrier taken from the previous high. Retracing lower the 21-day SMA at 1.0640, and slightly lower swing at 1.0630, could come next in focus and ahead of a more important support region of 1.0545 – 1.0530, where the bullish cross of the SMAs is encapsulated. If losses extend, the 1.0450 swing low could unfold before the June 2017 low of 1.0370 attracts attention.
Summarizing, short-term bullish signals are clear. If the price were to close below the 1.0530 level the neutral-to-bearish bias would return.

Recommend professional Forex robots


 Signal2forex.com - Best Forex robots and signals


