
How to Trade with Long Wick Candles — Complete Guide for Forex Traders (2026)
Long wick candles are one of the most powerful price-action signals in forex. This guide explains what they are, how to identify them, and exactly how to trade them — plus an interactive wick ratio calculator to sharpen your entries.
1. What Are Long Wick Candles?
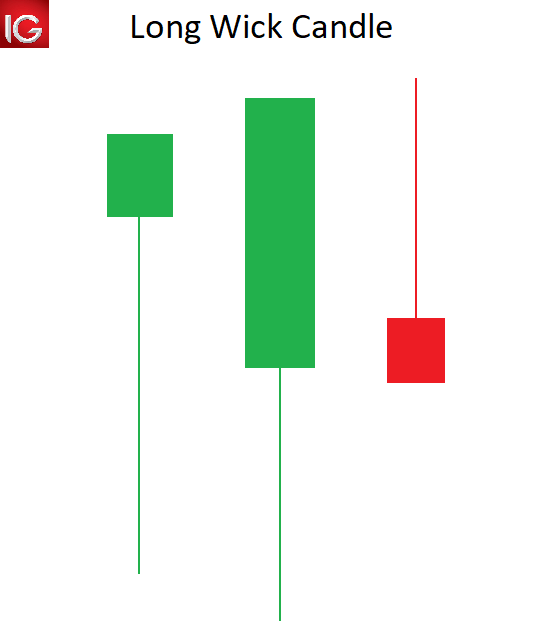
A long wick candle (sometimes called a “John Wick” candle in modern trading slang) is a candlestick where the upper or lower shadow (wick) is significantly longer than the real body. The body can be either bullish (green/white) or bearish (red/black) — the key is the extended wick.
These candles appear frequently across all financial markets — forex, commodities, indices, and crypto. They tell a powerful story: one side of the market tried to push price far in their direction, but the other side fought back aggressively before the close.
Key Features of a Long Wick Candle
- Extended shadow — at least 2–3 times the length of the real body.
- Small real body — opening and closing prices are relatively close.
- Rejection signal — the market attempted a breakout but was rejected.
2. Types of Long Wick Candles
Long wick candles fall into four main patterns. Each has a different implication for price direction.
| Candle Type | Upper Wick | Lower Wick | Body | Signal |
|---|---|---|---|---|
| Shooting Star | Long (2–3× body) | Short / none | Small | ⚠️ Bearish reversal |
| Hammer | Short / none | Long (2–3× body) | Small | ✅ Bullish reversal |
| Inverted Hammer | Long (2–3× body) | Short / none | Small | ✅ Bullish reversal |
| Hanging Man | Short / none | Long (2–3× body) | Small | ⚠️ Bearish reversal |
Long Upper Wick (Shooting Star / Inverted Hammer)
- Prices rallied sharply but closed far from the high.
- The upper shadow becomes a rejection line.
- Indicates buyers lost strength and sellers stepped in.
Long Lower Wick (Hammer / Hanging Man)
- Prices sank fast but recovered before the close.
- The lower shadow shows that lower levels were rejected.
- Suggests buyers defended the zone and may be ready for a bounce.
3. How to Identify Long Wick Candles on Forex Charts
The 2–3× Body Length Rule
A wick is considered “long” when it is at least twice the length of the real body. Many professional traders use 3× the body as a stronger filter.
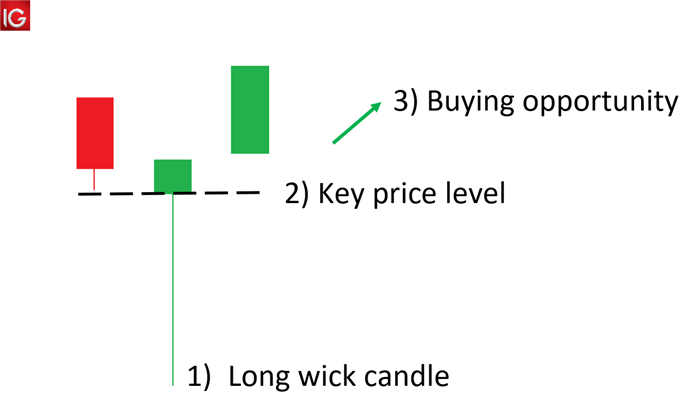
Context Matters — Support & Resistance
- Look for long wicks at key price levels — support, resistance, Fibonacci zones, or round numbers.
- Compare the wick length to surrounding candles — if it stands out, it’s significant.
- Use price action to confirm the level before entering a trade.

4. What Do Long Wicks Tell Us in Forex?
The Psychology Behind Long Wicks
A long wick captures a decisive shift in market sentiment. It represents a fierce rejection of the prevailing price direction within a single session.
- Bullish long wick (Hammer): Sellers pushed price down significantly, but bulls drove it back up — showing buyer strength. Since bulls overpowered selling pressure, upward movement may follow.
- Bearish long wick (Shooting Star): Buyers pushed price up significantly, but sellers drove it back down — showing seller strength. Downward movement may follow.
Rejection of Price Levels
Long wicks often form at support or resistance levels. When a long wick appears at resistance (upper wick), it signals that sellers are defending that level. When it appears at support (lower wick), it signals that buyers are defending that level.
5. How to Trade Long Wick Candles — Strategies
Strategy #1 — Reversal Trading
- Long upper wick near resistance → potential bearish reversal.
- Long lower wick at support → potential bullish reversal.
- Wait for confirmation — enter on the next candle after the wick appears.
- Place your stop-loss just beyond the wick extreme.
Strategy #2 — Wick Fill Trading
- Price often retraces to fill the wick left by a strong move.
- Place limit orders at the 50% or 61.8% retracement level of the wick.
- Target the opposite side of the wick or the next support/resistance level.
Strategy #3 — Breakout Confirmation
- Combine long wick signals with volume or trend indicators.
- Buy signal: long lower wick + price above 50-period SMA + above-average volume.
- Sell signal: long upper wick + price below 50-period SMA + above-average volume.
| Strategy | Entry Signal | Stop-Loss | Take-Profit |
|---|---|---|---|
| Reversal Trading | Confirmation candle after the wick | Beyond wick extreme | Next S/R level |
| Wick Fill Trading | Price retraces to 50% of wick | Beyond wick extreme | Opposite side of wick |
| Breakout Confirmation | Wick + SMA + volume confirmation | Below/above signal candle | Next S/R level |
6. Real-World Examples (2026)
Example 1: EUR/USD — Bullish Hammer at Support
On the daily chart, EUR/USD approached a major support zone at 1.0800. A Hammer formed with a long lower wick, signalling that buyers rejected the downside. The next day confirmed the reversal with a bullish close.
- Entry: 1.0815 (on confirmation candle)
- Stop-loss: 1.0780 (below the wick low)
- Take-profit: 1.0950 (next resistance level)
- Risk/Reward: ~1:3.5
Example 2: GBP/JPY — Shooting Star at Resistance
GBP/JPY rallied to a multi-week resistance at 192.50. A Shooting Star appeared with a long upper wick, showing that sellers were stepping in. Price reversed lower over the next three sessions.
- Entry: 192.20 (on confirmation candle)
- Stop-loss: 192.80 (above the wick high)
- Take-profit: 190.50 (next support level)
- Risk/Reward: ~1:2.8
7. Common Mistakes to Avoid
-
❌ Trading long wicks in low-liquidity or choppy markets
Wicks are most reliable in trending markets or at clear S/R levels. -
❌ Relying on the pattern alone
A long wick is a signal, not a guarantee. Always use confirmation and context. -
❌ Ignoring the trend context
Long wicks are most powerful at trend extremes — not in the middle of a range. -
❌ Placing stops too tight
Wicks often get retested. Give your trade room to breathe.
8. Wick-to-Body Ratio Calculator
Use this interactive tool to instantly determine whether a candle qualifies as a “long wick” and which direction the signal favours.
Wick Ratio Analyzer
Enter the candle’s measurements below. The calculator will show you the wick-to-body ratio and tell you whether it’s a valid long-wick signal.
Upper wick is 3.0× the body — strong bearish rejection, but lower wick is also present.
9. Frequently Asked Questions (FAQ)
What is a long wick candlestick?
A candlestick where the upper or lower shadow is at least 2–3 times longer than the real body. It signals a strong rejection of price at that level.
What does a long upper wick mean?
It means buyers pushed price up, but sellers aggressively pushed it back down. This is typically a bearish signal, especially near resistance.
What does a long lower wick mean?
It means sellers pushed price down, but buyers aggressively pushed it back up. This is typically a bullish signal, especially near support.
Can I trade long wick candles on any time frame?
Yes. Day traders often use 5‑minute or 15‑minute charts, while swing traders prefer 1‑hour, 4‑hour, or daily charts. The principles are the same across all time frames.
Do I need other indicators to trade long wicks?
While long wicks can be traded using pure price action, combining them with support/resistance levels, trendlines, or volume significantly improves reliability.
What is the difference between a hammer and a hanging man?
Both have long lower wicks and small bodies. The Hammer appears in a downtrend and signals a bullish reversal. The Hanging Man appears in an uptrend and signals a bearish reversal.
10. Conclusion
Long wick candles are one of the most reliable and frequently occurring price-action patterns in forex trading. They give you a real-time window into market psychology — showing you exactly where buyers and sellers have drawn their lines in the sand.
Key takeaways:
- ✅ A long wick is 2–3× the length of the real body.
- ✅ Upper wick = bearish rejection; lower wick = bullish rejection.
- ✅ Always trade with confirmation and in the context of the trend.
- ✅ Use the Wick Ratio Calculator above to sharpen your pattern recognition.
- ✅ Place your stop-loss beyond the wick extreme for a prudent risk management approach.
Want to learn more? Check out our other guides on Forex Basics and Price Action Trading.
Updated: June 2026
 Signal2forex.com - Best Forex robots and signals


