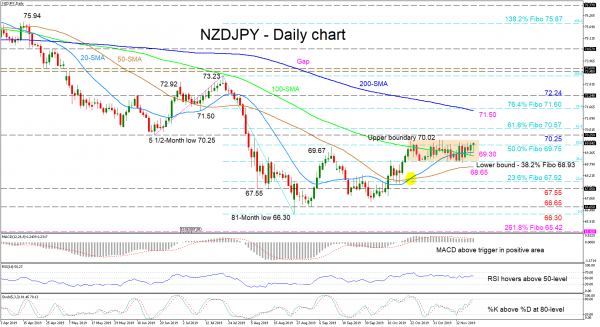
NZDJPY is in the process of pushing above the 69.75 restrictive level – which is the 50.0% Fibonacci retracement of the down leg from 73.23 to 66.30 – a point within a range of 70.02 to 68.93, which buyers have struggled with overcoming over the last month.
The short-term oscillators reflect weakness in directional momentum but lean slightly towards the positive picture, finding a minor backing from the bullish cross of the 20-day SMA. The MACD remains in the positive zone, barely above its red trigger line, while the RSI hovers above the 50-level. The Stochastic %K is at the 80-level supporting a move up yet could soon warrant attention in a pullback.
If buyers manage to push above the 69.75 level and the upper boundary of the range at 70.02, immediate resistance could be applied by the neighboring 70.25 level from June 18. Moving higher, the 61.8% Fibo of 70.57 may halt buyers gaining ground towards the 200-day SMA at 71.50 and marginally higher the 76.4% Fibo of 71.60.
To the downside, if the bears drive the price lower, the 20- and 100-day SMAs around 69.30 could deny the test of the lower boundary of the range at 68.93, which happens to be the 38.2% Fibo. Penetrating below, support could rest at the 50-day SMA at 68.65 before the focus turns to the 23.6% Fibo of 67.92 and support of 67.55.
Summarizing, the short-term bias is neutral and a break either above 70.02 or below 68.93 would set the direction.


 Signal2forex.com - Best Forex robots and signals


