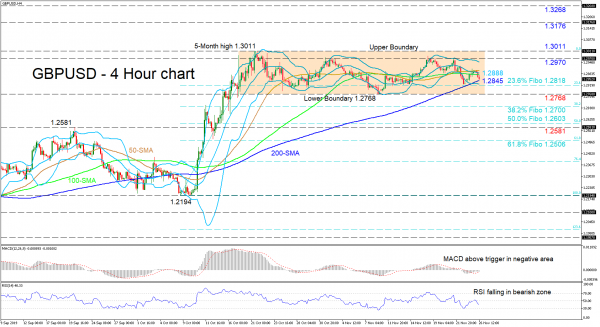
GBPUSD is trading around the upward sloping 200-period simple moving average (SMA) after the bounce off the 1.2818 support, which is the 23.6% Fibonacci retracement of the up leg from 1.2194 to 1.3011. The pair still looks undecided, having held in a sideways market from 1.3011 to 1.2768 for around a month.
The short-term oscillators also reflect mixed signals within momentum. The MACD indicates weakening negative momentum as it has moved above its red trigger line. Yet, the RSI’s view is one of increasing negative momentum as it is declining in bearish territory. Moreover, the mostly flat 50- and 100-day SMAs suggest the range may endure a while longer.
If buyers resurface and drive the price above the area of the mid-Bollinger band at 1.2888, where the 50- and 100-period SMAs are also located, the upper band and swing high around 1.2970 could restrict advances to test the upper boundary of the range at 1.3011. Superseding this five-month high, the peak of 1.3176 from May 3 and the resistance of 1.3268 from March 27 could draw some focus.
Otherwise, if sellers manage to conquer the immediate tough support coming from the 200-day SMA at 1.2845 and the lower-Bollinger band near the 23.6% Fibo of 1.2818, the lower boundary of the range at 1.2768 could be next to challenge the bears. Penetrating below, the 38.2% Fibo at 1.2700 could interrupt the test of the 50.0% Fibo at 1.2603 and the nearby support of 1.2581.
Overall, the short-term bias remains neutral and a break either above 1.3011 or below 1.2768 would set the next direction.


 Signal2forex.com - Best Forex robots and signals


