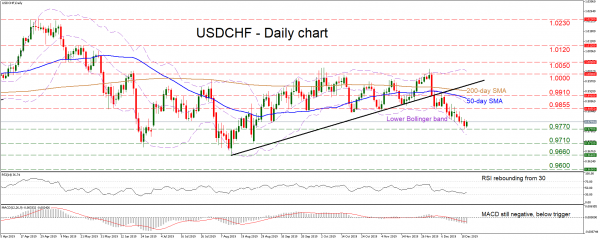
USDCHF broke below an uptrend line in early December, which later acted as resistance, forcing the market to head down and post a lower low on the daily chart. The near-term bias has therefore turned negative, something also endorsed by the downward slope in the 50-day simple moving average (SMA).
Negative momentum has taken a breather though, as indicated by the rebound off the 0.9770 zone and the latest upturn in the RSI. That said, the RSI is still well into its bearish territory, alongside the MACD, which is also beneath its red trigger line – both suggesting that the overall bearish structure is still intact.
If sellers retake control and pierce below 0.9770, their next target may be the 0.9710 zone, a break of which would turn the attention to 0.9660. Even lower, the 0.9600 handle may come into play, this being the low of September 18, 2018.
On the upside, should the latest recovery continue, the first obstacle for the bulls could be the 0.9855 zone, which acted as reliable support in recent months and may now act as resistance. If violated, the focus would then shift to the area around 0.9910, which also encapsulates the 50-day SMA at 0.9898.
In short, the break below 0.9855 has turned the outlook negative. For that to change, the bulls would need to push the battle above 1.0000.


 Signal2forex.com - Best Forex robots and signals


