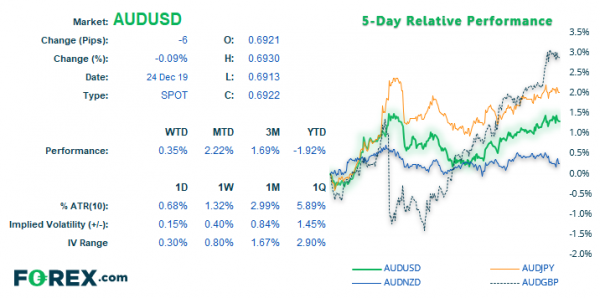
With the Aussie closing above its 200-day MA for the first time in 21 months, does it pave the way for a strong start on January, or is it a red herring? It depends.
The daily close above the 200-day MA is no small feat, given it has tried and failed several times to close above this milestone. Yet it should also be noted that when AUD/USD last closed above the 200-day MA in March 2018, it rolled over six sessions later and remained beneath it for the following 21 months. So a single, or even multiple closes above/below a 200-day MA isn’t necessarily a great predictor of the future.
Lower liquidity means we should treat technical signals with caution (particularly on lower timeframes). It could be argued that there’s an element of risk-on as US equities trade to record high, copper has broken a bearish trendline and AUD and NZD are also trading higher. Yet for all we know, AUD, NZD and copper shorts are simply closing out over the new year which is lifting prices. Until liquidity returns in January and responds appropriately to economic data, we really don’t know why these prices are rising. And we doubt this is a technically driven market either.
Basing pattern, or bearish correction? Stepping back, two potential patterns I’m monitoring is for whether AUD/USD is carving out a multi-month basing pattern, or a bearish wedge. If successful, the basing pattern would project a target around 0.7200, whereas the bearish wedge would project a pattern back near the 0.6670 lows.
A factor to observe as we head into the new year is how bullish any breakout is perceived to be. If we find the Aussie has a great start to the year and clearly breaks higher, then the bullish basing pattern becomes the more likely. Yet is we find that upswings lack momentum and news drives it lower, then we can focus on the bearish wedge.
Timing is also a key factor, as the wedge is still within its infancy whereas the basing pattern needs to break higher relatively soon.
Don’t forget the fundamentals. The jury is still out as to whether RBA will cut in February or not. A stronger employment set saw odds drop from 60% to 45% for a -25 bps cut. Yet another set of employment data and CPI is scheduled in January (among many other data points) and these are the more likely to swing the needle between a cut or a hold. Simply put, weak employment and CPI could quickly erode recent gains, whereas strong prints from either could send the Aussie higher.


 Signal2forex.com - Best Forex robots and signals


