Key Highlights
- USD/JPY is likely to accelerate gains if it clears the 109.80 resistance area.
- A strong support base seems to be forming near 109.20.
- The US Initial Jobless Claims for the week ending Dec 21, 2019 declined from 235K to 222K.
- EUR/USD and GBP/USD are showing signs of an upside correction.
USD/JPY Technical Analysis
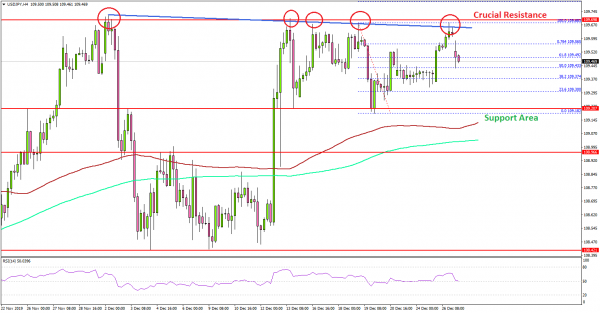
After a downside correction, USD/JPY remained well bid near the 109.20 area. The US Dollar is currently rising and it could make another attempt to settle above the key 109.80 resistance area.
Looking at the 4-hours chart, the pair traded as low as 109.18 and remained well above the 100 simple moving average (red, 4-hours). It climbed higher above the 109.50 resistance area.
Moreover, there was a break above the 50% Fib retracement level of the downward move from the 109.68 high to 109.18 low.
On the upside, there is a strong resistance forming near the 109.80 level and a bearish trend line on the same chart. If there is a successful close above 109.80, the pair is likely to accelerate higher above the 110.00 resistance area.
On the downside, the 109.20 area is a crucial support. If the bears succeed in pushing USD/JPY below 109.20, there are chances of a strong decline towards the 108.40 level.
Fundamentally, the US Initial Jobless Claims figure for the week ending Dec 21, 2019 was released by the US Department of Labor. The market was looking for a decline in claims from 234K to 224K.
The actual result was better than the forecast, as claims declined to 222K. Besides, the last reading was revised from 234K to 235K.
The report added:
The 4-week moving average was 228,000, an increase of 2,250 from the previous week’s revised average. The previous week’s average was revised up by 250 from 225,500 to 225,750.
Overall, USD/JPY is likely to accelerate gains if it clears the 109.80 resistance area. Moreover, both EUR/USD and GBP/USD are showing signs of an upside correction.


 Signal2forex.com - Best Forex robots and signals


