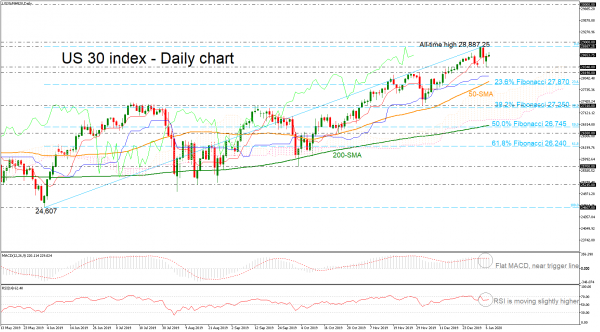
The US 30 index surpassed the red Tenkan-sen line and is currently trading slightly higher following the rebound on the latest low of 28,340, however, in the very short-term the technical indicators seem to be a bit flat
The MACD is hovering near the trigger line above the zero line, while the RSI is slowly moving higher in the daily chart.
Jumping above the latest record high of 28,887.25, the index could hit the round number of 29,000 and then the 30,000 strong psychological mark.
Otherwise, if the market weakens below the 28,190 – 28,340 support area, the 50-day simple moving average (SMA) currently at 27,958 could come in focus. Moving lower, the 23.6% Fibonacci retracement level of the upward rally from 24,607 to 28,887.25 near 27,870 and the 38.2% Fibo of 27,250 could attract traders’ attention as well.
In the long-term picture, a bull market began after the jump above the previous high of 27,310. In case of a drop below the 61.8% Fibo of 26,240, the outlook could switch to neutral.


 Signal2forex.com - Best Forex robots and signals


