Key Highlights
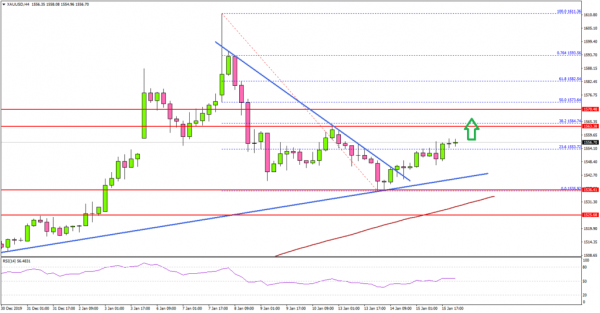
- Gold price corrected lower from $1,611 and tested the $1,535 support against the US Dollar.
- Recently, there was a break above a key bearish trend line with resistance near $1,545 on the 4-hours chart of XAU/USD.
- The US PPI increased 0.1% in Dec 2019 (MoM), less than the 0.2% forecast.
- The US Retail Sales is likely to increase 0.3% in Dec 2019 (MoM).
Gold Price Technical Analysis
After a strong rally, gold price topped near the $1,611 level against the US Dollar. Later, there was a sharp correction below $1,575 and the price tested the $1,535 support area.
The 4-hours chart of XAU/USD indicates that the price traded as low as $1,535 and remained well above the 100 simple moving average (red, 4-hours) and the 200 simple moving average (4-hours, green).
Recently, it started a fresh increase above the $1,540 and $1,550 resistance levels. Moreover, there was a break above a key bearish trend line with resistance near $1,545 on the same chart.
The price even climbed above the 23.6% Fib retracement level of the downward move from the $1,611 high to $1,535 low. On the upside, the first major resistance is near the $1,565 level.
To start another rise to $1,600, the price needs to climb above $1,575 and the 50% Fib retracement level of the downward move from the $1,611 high to $1,535 low.
Conversely, the price might fail to continue above the $1,565 and $1,575 resistance levels. In the mentioned case, it is likely to decline again towards $1,535 or the 100 SMA. Any further losses may perhaps lead the price towards $1,500.
Fundamentally, the Producer Price Index for Dec 2019 was released by the Bureau of Labor statistics, Department of Labor. The market was looking for an increase of 0.2% in the PPI in Dec 2019, compared with the previous month.
The actual result was lower than the forecast, the PPI increased 0.1%. Looking at the yearly change, the US PPI increased 1.3%, more than the last 1.1%.
The report added:
Prices for final demand less foods, energy, and trade services inched up 0.1 percent in December following no change in November. In 2019, the index for final demand less foods, energy, and trade services climbed 1.5 percent after advancing 2.8 percent in 2018.
Overall, gold price is facing hurdles near the $1,565 and $1,575 levels, above which it could restart its uptrend. Looking at EUR/USD, the pair broke a key hurdle near 1.1130, but GBP/USD is still well below 1.3100.
Economic Releases to Watch Today
- US Initial Jobless Claims – Forecast 216K, versus 214K previous.
- US Retail Sales Dec 2019 (MoM) – Forecast +0.3%, versus +0.2% previous.


 Signal2forex.com - Best Forex robots and signals


