GBPCAD has gained this week but it managed to still hold within the Ichimoku cloud in the daily timeframe. The price ran to a fresh six-week peak today at 1.7376, climbing above 1.7340, which is the 23.6% Fibonacci retracement level of the upward wave from 1.5875 to 1.7790, following the rebound off the six-month uptrend line.
The technical indicators are feeding prospects of a possibly more aggressive positive tendency; the RSI holds well above 50, while the MACD continues to strengthen in bullish territory and above its red trigger line. Also, in the Ichimoku indicators, the red Tenkan-sen keeps rising above the blue Kijun-sen.
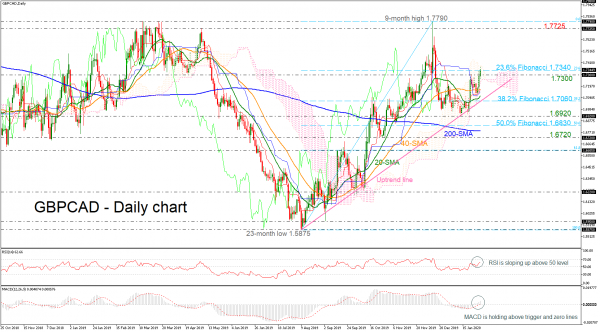
If 1.7340 proves easy to get through, the spotlight will turn to the 1.7725 area, reached on May 2019. On top of that, the bulls would need to clear the nine-month high of 1.7790 to push the rally to post a new ten-month high.
A failure to overcome the nearby resistance could send the price down to 1.7300 before flirting with the 40- and 20-day simple moving averages (SMAs) at 1.7165 and 1.7105 respectively. Lower, support could be next found around the 38.2% Fibo of 1.7060, which encapsulates the rising trend line, while a decisive close below these levels could stage a steeper sell-off towards 1.6920, creating a neutral bias in the short-term.
In the medium-term picture, the pair is still increasingly bullish as long as it holds above the short-term moving averages, and more importantly above the ascending trend line.
 Signal2forex.com - Best Forex robots and signals


