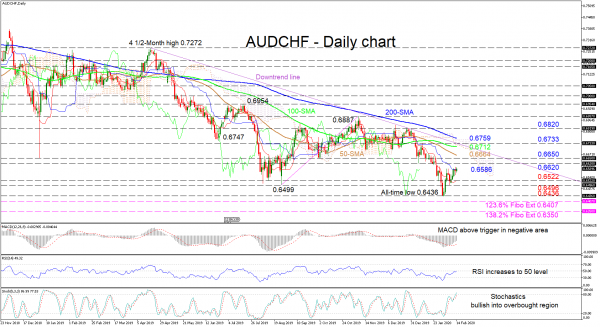
AUDCHF is currently flirting with the flat blue Kijun-sen line around 0.6586, following a pullback off the all-time low of 0.6436. Backing this improvement, is the red Tenkan-sen line that has turned up and the technical indicators.
The short-term oscillators reflect strengthening positive momentum. The rising Stochastic lines are entering the overbought region. Furthermore, the MACD is increasing above its red trigger line in the negative zone, while the RSI points up, barely below the 50 mark. However, traders need to keep in mind the medium-term descending trendline drawn from April 18, and the bearish simple moving averages (SMAs).
Retaking control, sellers could encounter initial resistance from the support area of 0.6522 to 0.6496, which also encompasses the red Tenkan-sen line. Overcoming this area, a revisit of the all-time low of 0.6436 could play out. Violating the bottom, the 0.6407 and 0.6350 obstacles – which are the 123.6% and 138.2% Fibonacci extensions of the up leg from 0.6499 to 0.6887 respectively – could halt further loss of ground.
Moving north past the blue Kijun-sen line, the inside swing lows of 0.6620 and 0.6650 could apply initial pressure towards the gaining move. Clearing these, the 50-day SMA at 0.6664 and the 100-day SMA at 0.6712 could impede the climb ahead of the nearby Ichimoku cloud’s lower-band and the downtrend line. Overhead, the 0.6733 resistance and the upper-band of the cloud coupled with the 200-day SMA around 0.6759 could deny the shift to a positive bias in the short-term and the test of the 0.6820 swing high.
Overall, if the pair fails to break above the long-term trendline, odds are the short- and medium-term bias remain bearish.


 Signal2forex.com - Best Forex robots and signals


