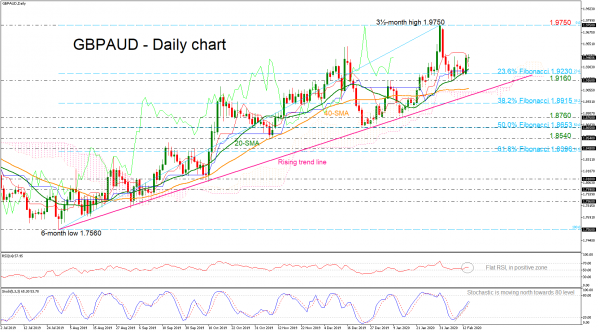
GBPAUD has gained little this week but it managed to hold above the 20-day simple moving average (SMA) and re-enter the 1.9400 area, however, the technical indicators feed prospects for a possible improvement in the near term. The RSI indicator is flattening in the bullish area, while the stochastic is heading north, approaching the 80 level. That said, the red Tenkan-sen line keeps falling slightly above the blue Kijun-sen line, reflecting the recent pause in positive momentum.
A failure to overcome the 1.9400 psychological numbercould send prices down to the 20-day SMA currently at 1.9280 ahead of the 23.6% Fibonacci retracement level of the upward wave from 1.7560 to 1.9750 near 1.9230. Below these, the 1.9160 support area could halt downside movements before re-testing the six-month uptrend line near the 40-day SMA and the Ichimoku cloud around 1.9060.
On the other side, if 1.9400 proves easy to overcome, the spotlight would turn to the three-and-a-half-month high of 1.9750, reached on January 31. A successful run higher could push the pair until the next resistance, which is coming from the 2.0500 level, signaling strong buying interest.
In the medium-term picture, GBPAUD is gently pointing up over this week, framing a positive profile. A strong rally above the three-and-a-half-month high of 1.9750 would extend the upward pattern, making the outlook even more bullish.


 Signal2forex.com - Best Forex robots and signals


