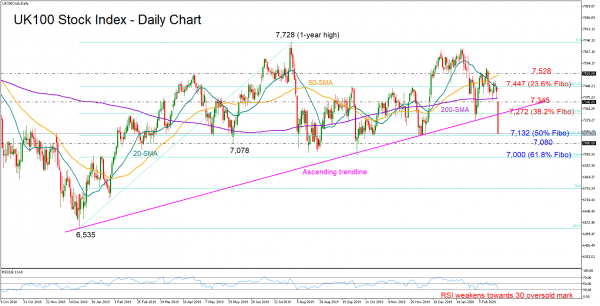
The UK 100 stock index slumped below the supportive trendline that has been holding since the end of 2018, increasing concerns that the market may be changing direction to south.
The downside reversal in the RSI, which is currently heading towards its 30 oversold mark, is a negative signal that the bearish action may get new legs in the short-term. Yet, a confirmation could only come below the 50% Fibonacci of 7,132 of the 6,535 – 7,728 up leg. If such an incident materializes, the market could search for new lows within the 7,080 – 7,000 restrictive zone, where the 61.8% Fibonacci also lies.
Alternatively, a rebound above the ascending trendline and the 38.2% Fibonacci of 7,272 would eliminate worries of a down-trending market, shifting the spotlight towards the 7,345 resistance region and the 200-day simple moving average (SMA) currently standing at 7,368. Slightly higher, the 23.6% Fibonacci of 7,447 should also attract attention in case of a steeper increase, while higher the 7,528 barrier will be watched next.
In short, the UK 100 index has broken a supportive trendline and expectations are for additional losses to follow if the 7,132 obstacle fails to defend the market.


 Signal2forex.com - Best Forex robots and signals


