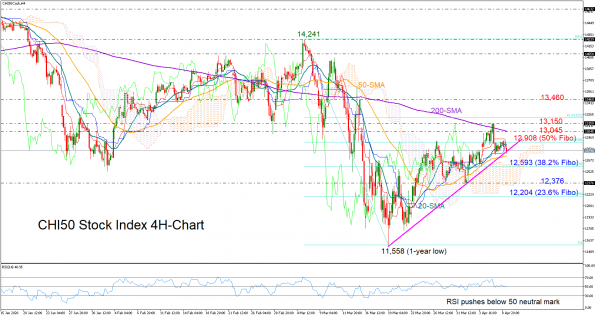
China’s 50 stock index (CHI50) is testing the ascending trendline that has been navigating the market since the slump to a one-year low of 11,558.
The negative cross between the red Tenkan-sen and the blue Kijun-sen lines and the weakening RSI on the four-hour chart hint that downside risks remain. To confirm that, the index needs to slip below the trendline and push towards the 38.2% Fibonacci of 12,593 of the downleg from 14,241 to 11,558. If sellers persist, traders could look for support near the previous low of 12,376, a break of which may reach the 23.6% Fibonacci of 12,204.
In case of an upside reversal, the 50% Fibonacci of 12,908 could open the door for the 13,045-13,150-resistance zone that encapsulates the 200-period simple moving average (SMA). Breaching the 61.8% Fibonacci of 13,222 too, the rally may pick up steam towards the 13,460 barrier.
In brief, the short-term risk for China’s 50 index is titled to the downside, with traders awaiting a confirmation below the ascending trendline.


 Signal2forex.com - Best Forex robots and signals


