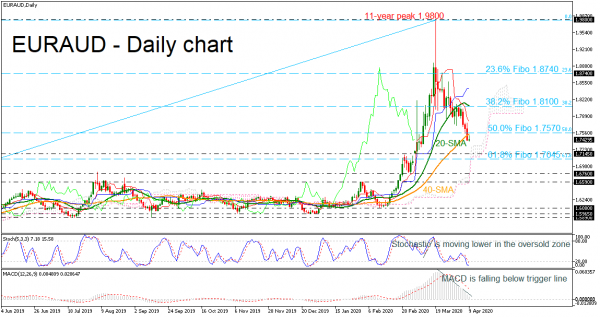
EURAUD is extending its negative rally below the 50.0% Fibonacci retracement level of the up leg from 1.5340 to 1.9800 at 1.8740 and beneath the 40-day simple moving average (SMA) currently at 1.7543. The selling interest started from the eleven-year peak of 1.9800, however, the long-term picture remains bullish.
Turning to the near-term, the MACD oscillator is approaching the zero line as it fell below the trigger line, indicating more losses. Furthermore, the stochastic is holding in the oversold area, stretching its bearish bias.
Immediate support is coming from the 1.7145 barrier ahead of the 61.8% Fibonacci of 1.7045. Taking a significant step lower could bring support at the 1.6760 inside swing high from August 2019 and the 1.6590 peak.
Alternatively, if the pair successfully surpasses the 50.0% Fibo of 1.7570, it would hit the red Tenkan-sen line of 1.7800. More upside pressure could add some sentiment to traders for bullish actions towards the 38.2% Fibo of 1.8100, which coincides with the 20-day SMA. A strong rally above this barrier could send the price to the 23.6% Fibo of 1.8740.
To conclude, in the short-term, EURAUD has been pointing down over the past month, framing a negative profile. A continuation of the last aggressive bearish move would shift the bullish outlook to neutral, in case of a fall below the 61.8% Fibo of 1.7145.


 Signal2forex.com - Best Forex robots and signals


