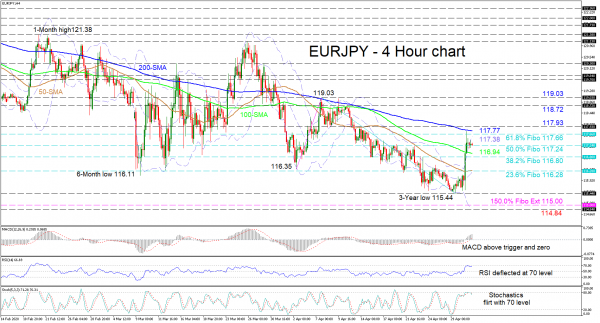
EURJPY is currently stuck around the 117.24 level, that being the 50.0% Fibonacci retracement of the down leg from 119.03 to the 3-year low of 115.44. The pause trails a pivot at the 200-period simple moving average (SMA) after the recent aggressive thrust upwards from the 115.44 low, overran the 50-and 100-period SMAs.
Looking at the short-term oscillators, the MACD, in the positive region is increasing above its red trigger line, while the RSI and stochastics back the bigger prevailing negative bearing of the SMAs. The RSI and stochastics are flirting around their 70 and 80 respective overbought levels, boosting odds for further downside moves, especially with the bearish crossover between the stochastic lines.
If buyers resurface, their first obstacle is a resistance trench from the 117.38 upper Bollinger band to the 117.93 high – which also encompasses the 61.8% Fibo of 117.66 and capping 200-period SMA of 117.77. Surpassing this key border, the pair may rally for the 118.72 high and 119.03 peak of April 7.
If sellers manage to push back under the 50.0% Fibo of 117.24, the 100-period SMA at 116.94 and the 38.2% Fibo of 116.80 underneath, could provide initial support to the drop. Steering lower, the 23.6% Fibo at 116.28 could prove more difficult to push past as it is strengthened by the 50-period SMA and mid Bollinger located around that spot. Steeper losses could retest the 3-year low of 115.44 ahead of the 115.00 to 114.84 area, which relates to the 150.0% Fibonacci extension of the up move from 116.35 to 119.03 and the April 2017 trough respectively.
Though, a neutral-to-negative picture endures, the very short-term bias has returned the price to a neutral stance. While a move below 115.44 would strengthen the negative outlook.


 Signal2forex.com - Best Forex robots and signals


