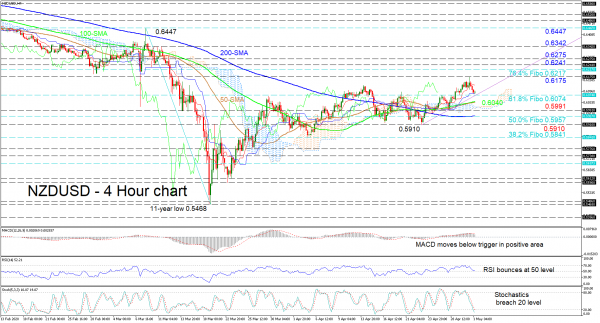
NZDUSD seems to have retraced slightly to the 0.6074 level – that being the 61.8% Fibonacci retracement of the down leg from the 0.6447 high to the 11-year low of 0.5468 – after the recent appreciation of the price above the simple moving averages (SMAs) and the Ichimoku cloud. The decline from 0.6175 appears to be finding some footing around the vicinity of a supportive trend line. Further backing for this view comes from the flattened Kijun-sen line, as well as the marginal improvement in the RSI, after a bounce off its 50 threshold.
Looking at the other technical signals, the red Tenkan-sen line, though having eased slightly, still holds its positive bearing while the MACD remains in the positive region, despite slipping just below its red trigger line. Additionally, the stochastic lines have entered the oversold territory, but have yet to exhibit bullish signals to support the present upwards incline.
If the ascending trend line denies further losses in price, the pair may find its first resistance at the nearby 0.6175 high before meeting the 76.4% Fibo of 0.6217 and inside swing low of 0.6241 from March 10. Succeeding these hurdles, the 0.6275 and 0.6342 highs could draw attention before focus shifts towards the 0.6447 peak.
In a downwards scenario, initial support may come from the 61.8% Fibo of 0.6074 coupled with the trend line, prior to encountering the merged 50- and 100-period SMAs around 0.6040. Diving past them, sellers may be challenged by the Ichimoku cloud and 0.5991 low ahead of the 50.0% Fibo of 0.5957, which is reinforced by the 200-period SMA.
Concluding, a move above 0.6200 could see a neutral bias returning in the medium-term while a shift above 0.6447 may see a neutral-to-bullish picture evolve in the short-term timeframe. That said, a close below 0.5910 may bring back fears for a downside tendency.


 Signal2forex.com - Best Forex robots and signals


