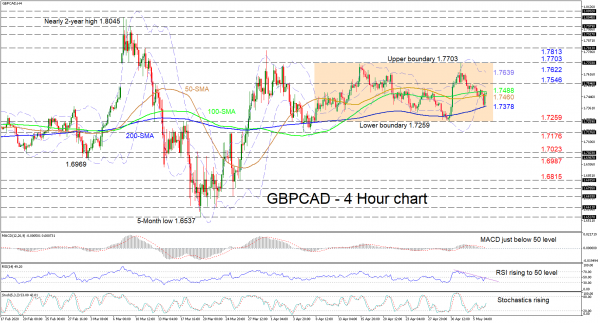
GBPCAD found some traction at the 200-period simple moving average (SMA) of 1.7378 following a drop from the 1.7703 level. The price is still within the confines of a short-term trading range since April 8, something also endorsed by the somewhat flat and converged SMAs.
The short-term oscillators display a paused picture of dried up momentum though reflect some signs of optimism. The MACD is barely below its red trigger line and the zero mark. However, the RSI has risen above the falling trend line and to the 50 threshold, while the stochastic lines are improving from the 20 level.
Should buyers push above the 100-period SMA at 1.7488, the mid-Bollinger band and the 1.7546 high could provide initial resistance ahead of the upper Bollinger band, presently at 1.7639. If buyers persist and overcome the tough upper boundary of the range at 1.7703, the pair could shoot to test the 1.7813 peak from March 11.
Alternatively, a downwards reversal under the 50-period SMA at 1.7460 could meet initial support from the lower Bollinger band and the 200-period SMA underneath at 1.7378. Moving down, the lower boundary of the consolidation at 1.7259 could test sellers ahead of the 1.7176 trough of April 7. Additional losses may be challenged by the 1.7023 – 1.6987 support region, while a run under could reach the 1.6815 low.
Summarizing, near-term price fluctuations seem confined for now between the bounds of 1.7259 and 1.7703 and a break below or above could boost the succeeding direction.


 Signal2forex.com - Best Forex robots and signals


