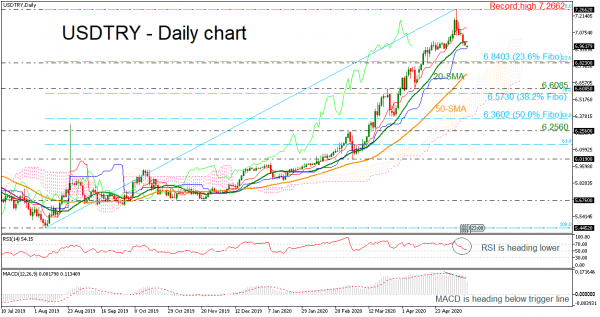
USDTRY held in losses for more than a week, dropping marginally below the 20-day simple moving average (SMA). The RSI continues to head lower in bullish area, while the MACD oscillator keeps falling beneath its trigger line, both suggesting a weaker price momentum in the short-term.
The price is currenty touching the flat Kijun-sen line and any declines below this barrier could shift the spotlight towards the 23.6% Fibonacci retracement level of the up leg from 5.4452 to 7.2662, at 6.8403. A drop below this line could send prices towards the 6.6085 support and the 38.2% Fibonacci at 6.5730, which stands near the lower surface of the Ichimoku cloud.
In the positive scenario, where the blue Kijun-sen line halts downside movements, the market should surpass the 20-day SMA in order to retest the record high of 7.2662. Above the latter, the price could enter new positive paths, challenging the 7.5000 and the 8.0000 round numbers.
In brief, USDTRY is facing negative short-term signals, though overall it maintains a bullish profile since January 2019.


 Signal2forex.com - Best Forex robots and signals


