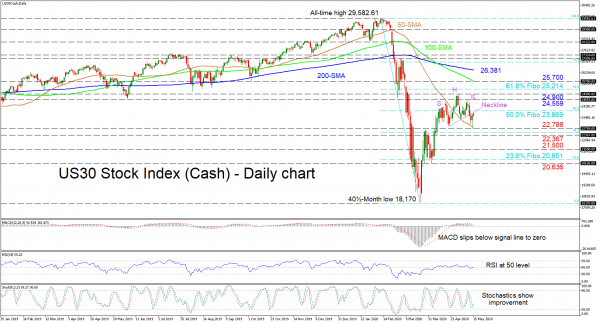
US 30 stock index’s (Cash) one-month ascent from the multi-year low of 18,170 seems to have eased, forming a head and shoulders pattern on the daily timeframe. The price is currently testing the neckline of the pattern barely under the 23,869 level, that being the 50.0% Fibonacci retracement of the down leg from the all-time-high of 29,582.61 to the 40½-month low of 18,170.
The short-term oscillators appear to be leaning towards the downside, accompanying the already negatively charged simple moving averages (SMAs). The MACD, in the positive zone, has dipping below its red trigger line and is heading to test the zero mark, while the RSI maintains a flat tone at its neutral threshold. Glancing at the stochastic oscillator, the %K line reflects the recent improvement in price, yet the negative bearing of the indicator is intact.
Should the price fail to overcome the 23,869 mark (neckline, 50.0% Fibo) and steer lower, this could increase the odds of the pattern, while a break below the 22,788 low (where the 50-day SMA is also placed) may boost the decline possible past the 38.2% Fibo and 22,367 support. A successful completion of the pattern could even extend the pair towards the 21,500 obstacle and to the lower region where the 23.6% Fibo of 20,851 and the trough of 20,636 reside.
Otherwise, if buyers push over the 50.0% Fibo of 23,869 (cancelling the head and shoulders pattern) resistance could initially be met from the key 24,559 and 24,900 peaks ahead of the 61.8% Fibo at 25,214. Running higher, the 100-day SMA at the 25,700 barrier could prevent the pair reaching the 200-day SMA at 26,381.
Concluding, the unfolding of the pattern could ultimately reveal the next direction within the short-term, while the bias seems to be tilting to the downside as things stand


 Signal2forex.com - Best Forex robots and signals


