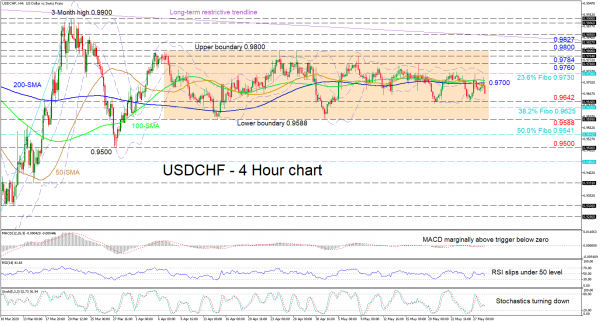
USDCHF presently below the 0.9700 mark, continues to zig zag above and below the mostly horizontal simple moving averages (SMAs) in a directionless market that has endured since early April.
Glancing at the short-term oscillators, they too mirror weak directional momentum within the confines of 0.9588 and 0.9800. The MACD is just above its red signal line and barely beneath zero, while the RSI has just dipped below its 50 threshold promoting declines. Moreover, the stochastics are also uncertain around the 40 point showing no signs of direction.
Should sellers stretch the price down within the range, initial support may occur at the lower Bollinger band around the 0.9642 obstacle. A step underneath could rest at the 0.9625 level, that being the 38.2% Fibonacci retracement of the up leg from the 56½-month low of 0.9182 to the 0.9900 peak, ahead of the lower boundary at 0.9588. Violating the foundation of the consolidation pattern, the bears may dive to the 50.0% Fibo of 0.9541 before testing the 0.9500 significant trough.
Otherwise, a run above the converged SMAs may find strong resistance from the 23.6% Fibo of 0.9730 – where the upper Bollinger band lies – ahead of the 0.9760 and 0.9784 highs, on the way to the ceiling of 0.9800. Piercing the roof of 0.9800, the bulls may encounter the 0.9827 high before the long-term descending trend line drawn from 26 April 2019.
Summarizing, the short-term bias remains undecided for now and either a break above 0.9800 or below 0.9588 is required to set the next clear price path.


 Signal2forex.com - Best Forex robots and signals


