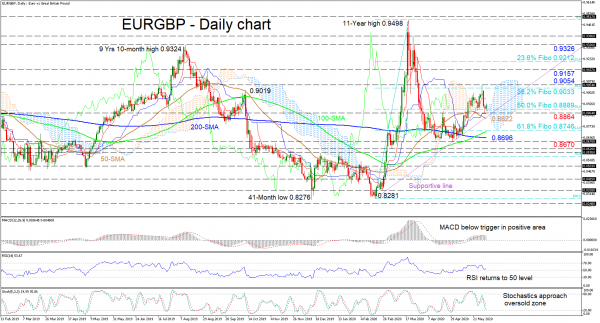
EURGBP’s recent ascent to 0.9054 seems to have stalled, reversing back down to the 0.8889 level, that being the 50.0% Fibonacci retracement of the up leg from 0.8281 to the 11-year peak of 0.9498. The current inactive demeanour within the pair is also reflected in the flattened Ichimoku lines.
Directional momentum appears to have dried up with conflicting signals now emerging from the short-term oscillators. The MACD, in the positive section, has slipped below its red signal line, while the RSI improves barely above its 50 threshold. In spite of this, the stochastic %K line has reached the oversold territory, though a reversal cannot be ruled out. Worth mentioning is the ascending trend line and the 100-day SMA, which sponsor an improving picture, while the falling 50-day SMA reflects the pause in the up move.
Should buyers try to resume a positive tone, the red Tenkan-sen line could hinder the price prior to a crucial resistance region from the 38.2% Fibo of 0.9033 to the 0.9054 high. Conquering this border, the focus may turn to the 0.9157 barrier, which if broken, could see the 23.6% Fibo of 0.9212 and the 0.9326 high come into play.
Alternatively, immediate support could arise from the 50.0% Fibo of 0.8889 and the supportive trend line that coincides with the 0.8864 level. Steering below the trend line could meet the 50-day SMA at 0.8822 before further losses test the 61.8% Fibo of 0.8746 and the 100-day SMA beneath.
Summarizing, as stands, the pair may edge sideways towards the ascending trend line before a clear direction is revealed.


 Signal2forex.com - Best Forex robots and signals


