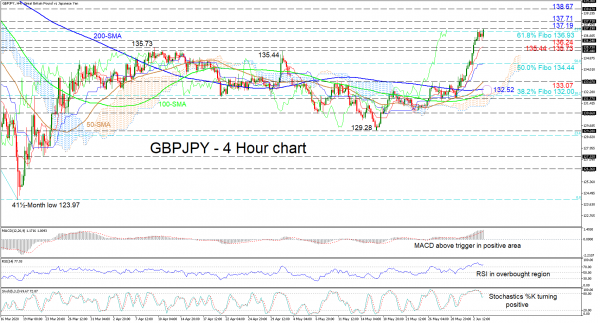
GBPJPY is in the process of breaking above the 136.93 level – that being the 61.8% Fibonacci retracement of the down leg from 144.94 to the 41½-month low of 123.97 – and the nearby 137.19 barrier. The pick up in price is starting to be reflected in the Ichimoku lines and the short-term oscillators.
The MACD, deep in the positive region, is increasing above its red trigger line, while the RSI is beginning to improve in the overbought section. Furthermore, the stochastic %K line has pivoted upwards suggesting further advances. On top of this, the nearing of a bullish crossover of the 200-period simple moving average (SMA) by the 100-period SMA around 132.52 could aid the positive picture.
Should the price break above the 137.19 high of March 10, the 137.71 barrier may provide the first restrictions to upside moves. Overrunning this, a vital peak of 138.67 from March 5 may apply the brakes, bringing the climb to a halt.
Otherwise, if sellers reverse the price back below the 61.8% Fibo of 136.93, initial limitations may commence at the 136.24 level ahead of the support region from 135.73 to 135.44. Steering below these borders could send the pair towards the 50.0% Fibo of 134.44 followed by the 133.07 low, where the 50-period SMA is also located.
Overall, the very-short-term timeframe remains positively charged above the Ichimoku cloud and the 131.77 low, with a break above 138.67 boosting a bullish outlook.


 Signal2forex.com - Best Forex robots and signals


