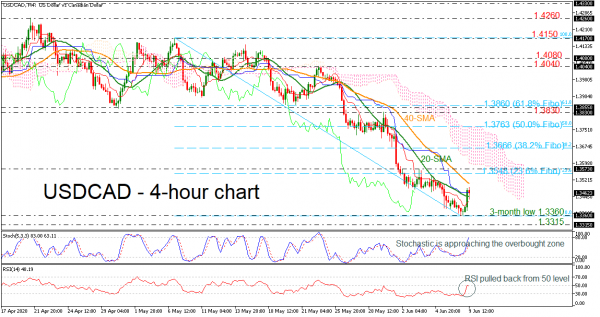
USDCAD has been in declining movement over the last month but is currently trading above the three-month low of 1.3360. The stochastic oscillator is approaching the overbought zone; however, the RSI is pointing down after the touch on the neutral threshold of 50. Also, the red Tenkan-sen line is holding below the blue Kijun-sen line, suggesting more losses in the near term.
A downfall below the 20-period simple moving average (SMA) could find immediate support at the three-month low of 1.3360. Not far below, support could occur around the 1.3315 barrier, achieved on March 3. Even lower, the 1.3200 psychological mark would be eyed.
On the upside, the 40-period (SMA) at 1.3504 could come into the spotlight ahead of the 23.6% Fibonacci retracement level of the down leg from 1.4170 to 1.3360 at 1.3548 and the 1.3573 resistance. If the latter is violated too that could strengthen momentum towards 1.3666, which is the 38.2% Fibonacci could be the next target.
Turning to the medium-term picture, the bearish outlook is still into play, especially after the bridge of the 1.3830 – 1.3855 levels. A jump above that point would restore the neutral mode. For a bull market though traders need to wait for a clear close above 1.4260, taken from the top on April 21.


 Signal2forex.com - Best Forex robots and signals


