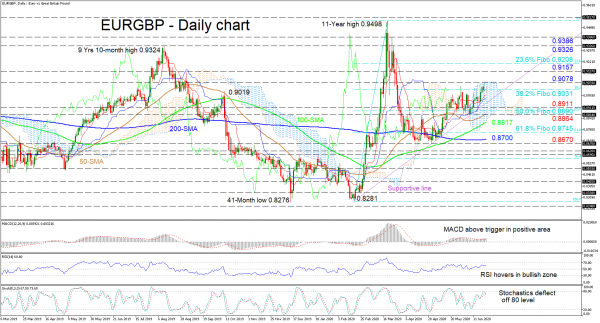
EURGBP has reversed from the upper surface of the Ichimoku cloud to the 0.9031 level, that being the 38.2% Fibonacci retracement of the up leg from 0.8281 to the 11-year high of 0.9498. Positive sentiment appears revived after the bounce on the supportive trend line pulled from the February 18 low of 0.8281.
Further backing this short-term view are the Ichimoku lines and the upward slopes of the 50- and 100-day simple moving averages (SMAs). However, for now the technical oscillators reflect contradicting signals. The MACD, in the positive area, remains flat above its red signal line, while the RSI hovers in bullish territory. That said, reflecting weakness in price is the stochastic %K line, which has deflected off the 80 level and completed a bearish overlap of the fading %D line.
If buying interest picks up, early tough resistance could occur at the 0.9078 high, where the ceiling of the cloud also resides. A violation of this level may shoot the pair to challenge the 0.9157 barrier and the 23.6% Fibo of 0.9208 above. If advances endure past these obstacles, buyers may then target the 0.9326 and 0.9386 tops, before considering the more than a decade summit.
Otherwise, if sellers sink deeper into the cloud, the Ichimoku lines and the diagonal line could provide the initial key constrictions necessary to sustain the climb. Steeper declines under the line would have to tackle a more durable support section from 0.8911 to the 0.8864 low, which encompasses the 50.0% Fibo of 0.8890 and the 50-day SMA. Extending lower could encounter the 100-day SMA at 0.8817 and the 61.8% Fibo of 0.8745 heading towards the 200-day SMA at 0.8700.
Overall, the very near-term picture remains positive above the ascending line and the 0.8864 low, while a break below 0.8670 would cement negative worries.


 Signal2forex.com - Best Forex robots and signals


