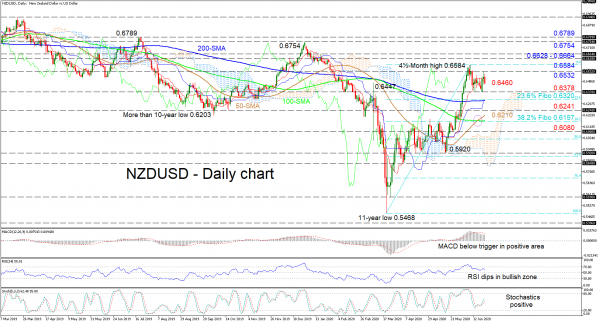
NZDUSD is dragging sideways as it lingers in a paused mode that has seized control of the ascent, something also reflected in the red Tenkan-sen line. Positive signals are still unbroken, sponsored by the Ichimoku lines and the rising 50-day simple moving average (SMA), in spite of the mostly flattened longer term averages (100- and 200-day SMAs).
The momentum indicators further emphasize the stall in the climb but lean more towards an improving picture. The MACD, although below its red signal line deep in the positive region, appears may reclaim it, while the RSI weakens slightly in the bullish section. Additionally, the stochastic lines are strengthening with room to move until the 80 mark.
If buyers push higher, boosted by the recent bullish crossover of the 100-day SMA by the 50-day one, immediate resistance could occur at the 0.6532 obstacle ahead of the fresh peak of 0.6584. Overcoming the four-and-a-half month peak, the bulls could face a nearby resistance region from 0.6628 – 0.6664. Further advances may then target the 0.6754 and 0.6789 tops achieved in December and July of last year.
Alternatively, if sellers break below the 0.6378 initial low, the crucial 0.6320 level – where the 200-day SMA and blue Kijun-sen line reside – could apply the brakes on the decline. Should this level fail to do so, which happens to be the 23.6% Fibonacci retracement of the up leg from 0.5468 to 0.6584, the 0.6241 support could come next followed by the 50-day SMA at 0.6210. Further losses could test the 38.2% Fibo of 0.6157 coupled with the 100-day SMA before attention shifts to the 0.6080 trough of May 25.
Summarizing, the short-term bias maintains its bullish tone above the 0.6378 mark and more importantly above the SMAs.


 Signal2forex.com - Best Forex robots and signals


