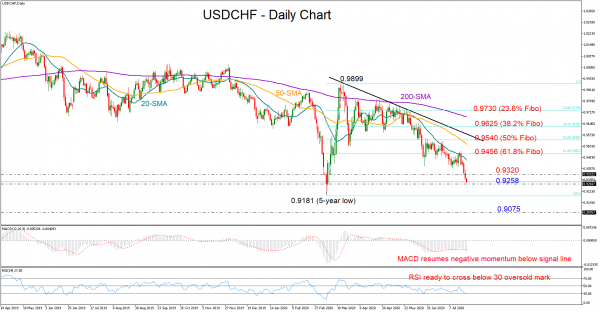
USDCHF is bearishly exposed to the nearby 0.9258 support level after failing to crawl above the 61.8% Fibonacci retracement level of the March rally last week.
The technical indicators are framing a discouraging picture for the short-term too, as the price is further deviating below the downward-sloping 20-day simple moving average (SMA) and the MACD is gaining negative momentum below its red signal line. The falling RSI, which is ready to cross below its 30 oversold mark is another negative signal.
If sellers claim the 0.9258 mark, all eyes will turn to the 5-year low of 0.9181. Beneath that, the pair will reactivate the long-term downtrend from May 2019, with the price likely searching a new lower low around 0.9075.
Otherwise, if the bulls put breaks to the sell-off, pushing the price above 0.9320, the 20-day SMA at 0.9410 and the 61.8% Fibonacci of 0.9456 may come again under the spotlight. What buyers, however, would like to see is a rally above the descending trendline stretched from the 0.9899 peak, currently slightly above the 50% Fibonacci of 0.9540.
In brief, USDCHF could head for the 5-year low of 0.9181 unless the nearby support of 0.9258 blocks the way to the downside.


 Signal2forex.com - Best Forex robots and signals


