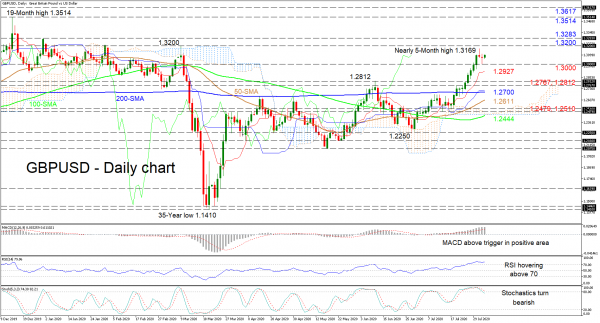
GBPUSD hit a snag after its recent appreciation reached a near five-month high of 1.3169, slightly below a significant resistance at the 1.3200 level. The minor retreat in price is mirrored in the reduced bullish slopes of the Ichimoku lines and the bearish orientation of the stochastic oscillator around the 80 level.
That said, the MACD and RSI maintain a paused positive demeanour, while the rising 50- and 100-day simple moving averages (SMAs) uphold a positive charge. The MACD, deep in the positive region, is flat above its red trigger line and, the RSI has yet to confirm significant weakness as it hovers in overbought territory.
If buying interest picks up, initial resistance may develop around the near five-month high of 1.3169 and the key resistance of 1.3200 overhead. If these tough borders fail to halt advances, the pair may meet the 1.3283 barrier from the end of last year. Overcoming this too, further gains may test the 1.3514 peak prior to attempting to extend towards the 1.3617 obstacle from May of 2018.
Otherwise, if sellers manage to push under 1.3000, the red Tenkan-sen line at 1.2927 and the inside swing highs of 1.2812 and 1.2767 may provide initial support. Should the blue Kijun-sen line and the 200-day SMA at 1.2700 not provide adequate foundation to keep the bears at bay, the 50-day SMA at 1.2611 could come into play. Steeper losses may challenge the vital troughs of 1.2510 and 1.2479 respectively, followed by the cloud’s lower surface coupled with the 100-day SMA at 1.2444.
Overall, the neutral-to-bullish bias remains tilted to the upside in the short-to-medium term as long as the price holds above 1.2812, while a break above 1.3200 could boost the positive picture.


 Signal2forex.com - Best Forex robots and signals


