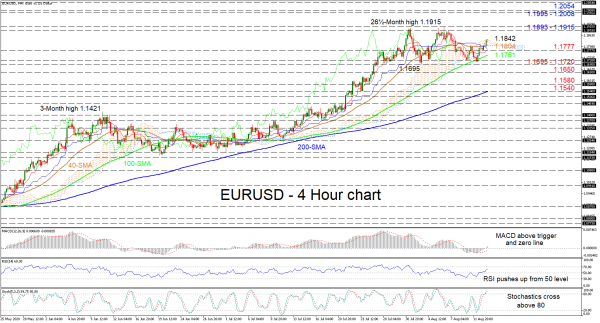
EURUSD appears to have consolidated its advancements between 1.1695 and 1.1915, despite existing positive signals. In the meantime, the price is engaging the Ichimoku clouds upper band at 1.1842, while the 50-period simple moving average (SMA), the cloud and Ichimoku lines, sponsor a horizontal bias.
Nonetheless, the short-term oscillators and the bullish tone of the 50- and 100-period SMAs, promote further improvements. The strengthening MACD has risen above its red signal line and the zero mark, while the RSI is trying to gain ground in bullish territory. Additionally, the stochastic oscillator has climbed into the overbought zone, but has yet to signal signs of weakness.
If buyers manage to penetrate above the cloud at 1.1842, initial fortified resistance may develop from the section of recent peaks from 1.1893 to 1.1915. Defeating this key ceiling, the pair may run up to encounter another obstructing region of tops, from 1.1995 to 1.2008, stretching back to May 2018. If this zone around 1.2000 fails to halt the ascent, the pair may turn its focus to the 1.2054 barrier, identified in April of 2018.
Alternatively, if sellers cause a dip in the pair, early support may arise from the 50-period SMA – located at the floor of the cloud – standing at 1.1804 ahead of the 1.1777 low, where the Ichimoku lines reside. A leg lower, the price may rest at the 100-period SMA at 1.1751 prior to challenging the crucial region of troughs, from 1.1695 to 1.1720. Breaking under this foundation may send the euro towards the 1.1650 support, reaching back to September 2018, while further deterioration could extend to the 1.1580 low and the 200-period SMA at the 1.1540 mark.
Overall, the very-short-term picture is holding a neutral-to-bullish tone above 1.1695. A break either above 1.1915 or below 1.1695 could reinforce the next relevant course in the pair.


 Signal2forex.com - Best Forex robots and signals


