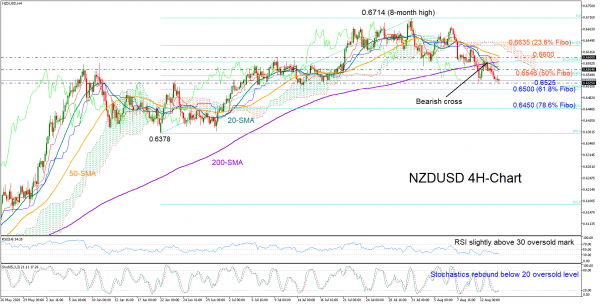
NZDUSD changed course to the downside this month, printing lower highs and lower lows after peaking at a new 8-month high of 0.6714 in the four-hour chart. Besides the negative price action, the bearish cross registered between the 20- and 200-period simple moving averages (SMAs) this week, which is the first since January, further raised concerns of a down-trending market.
With the Stochastics pushing for a rebound just below their 20 oversold level and the RSI not far above 30, there is a potential for an upside correction in the short-term.
Should the 0.6546 nearby resistance territory, which coincides with the 50% Fibonacci of the 0.6378 – 0.6714 upleg, give way, the SMAs could press the price within the 0.6564-0.6600 area. A break higher would eliminate the risk of a stronger downtrend, shifting the focus towards the 23.6% Fibonacci of 0.6635.
If the pair decelerates below the 0.6525-0.6500 supportive region, where the 61.8% Fibonacci is placed, a steeper decline could take place until the 78.6% Fibonacci of 0.6450. In this case, the market would mark a new lower low in the chart, putting the March uptrend under examination.
In brief, NZDUSD is favouring the bears for the time being, but upside corrections cannot be ruled out as the pair seems to be trading in oversold waters. Nevertheless, the negative sentiment may not fade unless the price jumps above 0.6586.


 Signal2forex.com - Best Forex robots and signals


