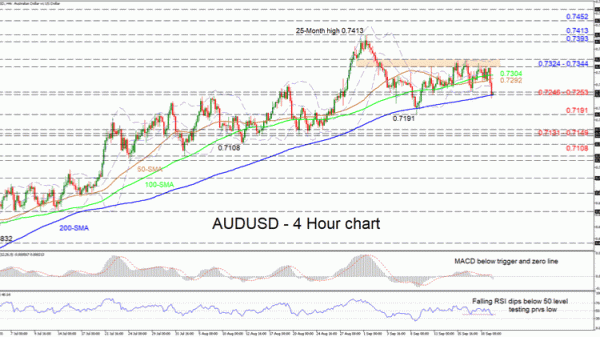
AUDUSD is tackling the lower Bollinger band coupled with the 200-period simple moving average (SMA), after recently dipping below the 50- and 100-period SMAs. The price seems temporary stalled between the boundaries of 0.7246 and 0.7344, though sustaining a broader positive structure. The rising SMAs still convey a progressing picture despite a snag in the 50-period SMA.
The short-term oscillators reflect fragile negative directional momentum, mirroring the recent fading in the price. The MACD has retraced below its red trigger line and decreased below the zero mark, while the RSI is weakening under its neutral threshold, testing a previous low.
To the downside, immediate hardened support may originate from the 0.7246 to 0.7253 section, where the lower Bollinger band and the 200-period SMA presently reside. Clearing this border, the 0.7191 key trough could attempt to dismiss further loss of ground. Should it fail to rescue the prevailing climb, the price may sink to challenge the 0.7131 to 0.7149 area of lows, from mid-to-end of August, before targeting the 0.7108 barrier.
Otherwise, a rebound off the 200-period SMA around 0.7246 could see early resistance commence from the 50- and 100-period SMAs at 0.7292 and 0.7304 respectively. Pushing above the mid-Bollinger, buyers will encounter significant resistance from the ceiling of this near-term range from 0.7324 to 0.7344, which comprises of multiple highs and the upper Bollinger band. Surpassing this zone could shoot the pair towards the 0.7393 peak from December 2018, before revisiting the 25-month top of 0.7413. Additional gains may then home in on the 0.7452 obstacle from August 2018.
Summarizing, the short-to-medium term picture maintains a bullish bias above the 0.7191 trough. That said, should the pair clearly close below the 200-period SMA, this may reinforce weakness in the pair in the near-term.


 Signal2forex.com - Best Forex robots and signals


