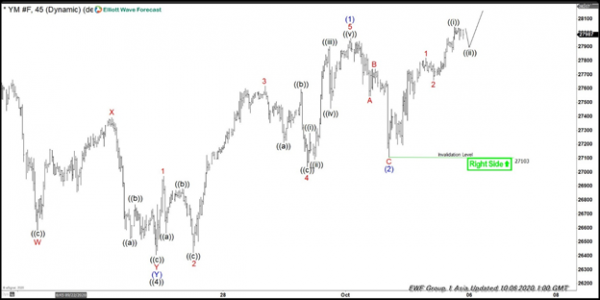
Elliott Wave view in Dow Futures (YM) suggests that the rally from March 23, 2020 low remains in progress as a 5 waves diagonal Elliott Wave structure. In the 45 minutes chart below, we can see wave ((4)) of that diagonal ended at 26407. The Index still needs to break above previous peak on September 3 at 29180 to avoid a double correction.
Wave ((5)) is currently in progress as an impulse Elliott Wave structure. Up from wave ((4)) at 26407, wave 1 ended at 26971, and pullback in wave 2 ended at 26424. Index resumed higher in wave 3 at 27619, wave 4 pullback ended at 27039, and wave 5 ended at 27962. This completed wave (1) of ((5)) in higher degree.
From there, Index pullback in wave (2) and ended at 27105 as a zigzag Elliott Wave structure. Down from wave (1) at 27962, wave A ended at 27543, wave B ended at 27741, and wave C ended at 27105. Index has resumed higher and broken above wave (1) at 27962, suggesting the next leg higher has started. Near term, while dips stay above 27105 low, expect Index to extend higher.
Dow Futures (YM) 45 Minutes Elliott Wave Chart


 Signal2forex.com - Best Forex robots and signals


