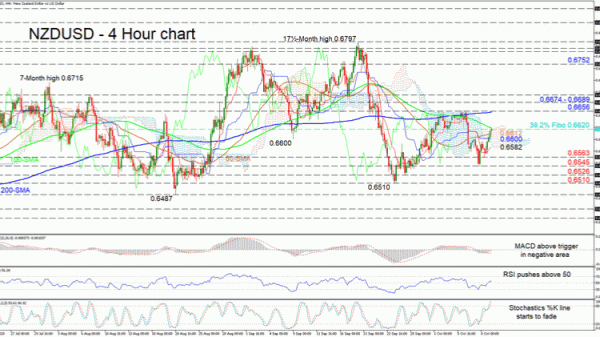
NZDUSD appears to be stuck in a horizontal market, backed by the Ichimoku cloud, and is currently capped by the downward sloping 100-period simple moving average (SMA) at 0.6620. The pair is struggling to overtake this level that also happens to be the 38.2% Fibonacci retracement of the down leg from 0.6797 to 0.6510. The conflicting Ichimoku lines reflect an easing in negative momentum, while the gradual rising of the 50-period SMA suggests weakness in downward drive.
The short-term oscillators mirror the improvement in price sentiment. The MACD, in the negative region, is rising above its red signal line towards zero, while the RSI is attempting to maintain its recent jump above its neutral threshold. In the stochastic oscillator, the %K line is fading slightly in overbought territory but has yet to confirm any negative tendencies. Nonetheless, traders cannot rule out another wave of weakness in the pair.
If the bulls persist, immediate resistance may occur at the 38.2% Fibo of 0.6620, where the 100-period SMA and upper band of the cloud also reside. Surpassing this heavy border may thrust the price upwards to tackle another tough boundary, being the 200-period SMA adjacent to the 0.6656 peaks. Should buyers conquer this zone too, the price may challenge the limiting section from 0.6674 to 0.6689, before targeting the 0.6752 barrier.
To the downside, quick support may develop from the 50-period SMA at 0.6612 and the blue Kijun-sen line at 0.6600 ahead of the cloud’s floor at 0.6582, which is in-line with the red Tenkan-sen. Slipping further, the pair could reach the 0.6563 low before sellers test the 0.6545 obstacle. In the event steeper declines unfold, the 0.6526 level and the 0.6510 trough may draw traders’ attention.
Summarizing, the short-term timeframe maintains a neutral-to-bullish tone. A break either above 0.6656 or below 0.6545 could reveal the next direction.


 Signal2forex.com - Best Forex robots and signals


