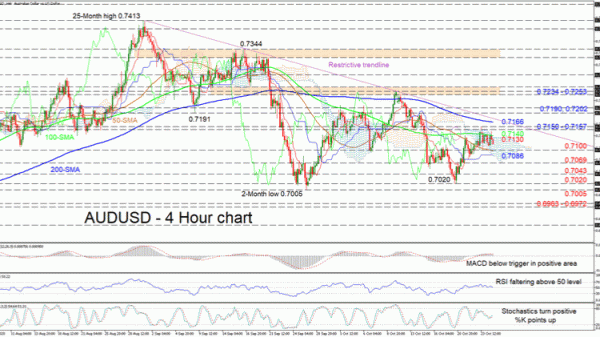
AUDUSD is creeping sideways in the Ichimoku cloud after the 100-period simple moving average (SMA), at the cloud’s upper surface, capped advances off the 0.7020 mark. The gradual downward sloping SMAs are upholding a bearish tone, while the positively charged Ichimoku lines are nudging the price closer to the descending trend line.
The short-term oscillators are conveying conflicting signals in directional momentum. The MACD is hovering below its red signal line in the positive region, while the RSI is failing above its 50 threshold. Yet, the stochastic %K line is strengthening above its %D line, promoting positive price action.
Steering the pair deeper into the cloud, initial support may come from the 50-period SMA located at the 0.7100 hurdles. Stepping lower may reinforce negative tendencies hitting the blue Kijun-sen line at 0.7086 ahead of the 0.7069 low. Should further ground be lost, the price may meet the 0.7043 obstacle before challenging the 0.7020 and 0.7005 key troughs respectively. If these critical barriers fail to dismiss the decline, the bearish picture may resume, aiming for the support section of 0.6963 – 0.6972.
Alternatively, if buyers drive the pair over the zone (0.7130 – 0.7140) where the red Tenkan-sen line, cloud’s ceiling and 100-period SMA reside, early limitations may arise from the resistance band of 0.7150 – 0.7157. Overtaking this section, the bulls may then face heavy obstructions that being the nearby 200-period SMA at 0.7166 and adjacent restrictive trend line. Surpassing these tough boundaries, the climb may hit the 0.7190 and 0.7202 highs, before targeting the opposing zone of 0.7234 – 0.7253.
Summarizing, AUDUSD maintains a bearish outlook below the descending line, the 200-period SMA at 0.7166 and the 0.7157 high. That said, it appears the pair may edge sideways towards the falling line before a clearer picture takes form.


 Signal2forex.com - Best Forex robots and signals


