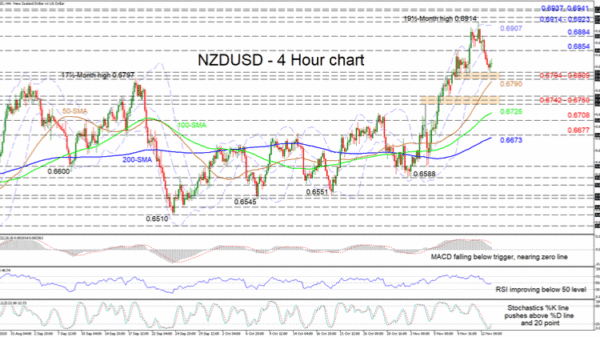
NZDUSD peaked at a 19½-month high of 0.6914 following a one-week ascent from 0.6612, before being pulled back below the mid-Bollinger band. The pair has found some footing at the upper part of a support base surrounding the lower Bollinger band. The upward sloping simple moving averages (SMAs) are sustaining a strong bullish bearing while momentum in the short-term oscillators appears to be picking up.
The MACD, in the positive region, is decreasing below its red trigger line but its downward pace seems to be easing. The RSI is strengthening below the 50 neutral mark while a positive drive is reflected in the stochastic %K line, as it steers over the %D line and the 20 level.
If buyers manage to drive the pair up, initial resistance may come from the 0.6854 barrier, where the mid-Bollinger band currently resides. Persistent buying may test the 0.6884 high before encountering tough resistance from the upper Bollinger band at 0.6907 and the section overhead of 0.6914-0.6923. Surpassing this obstructing zone, the pair may jump towards the 0.6937 and 0.6941 congested tops from March and February 2019, respectively.
Otherwise, pivoting down, sellers may face a hardened support region from 0.6809 until 0.6794, which encapsulates the lower Bollinger band, and has the 50-period SMA approaching from beneath. Should sellers manage to dive past this obstacle and the 50-period SMA at 0.6790, another support area of 0.6742-0.6750 may attempt to rescue the descent towards the 100-period SMA at 0.6725 and the nearby 0.6708 level. Correcting further could steer the price towards the 0.6677 barrier and the 200-period SMA at 0.6673.
Summarizing, NZDUSD is holding onto its short-to-medium-term bullish demeanour above the 0.6794 level while a push lower would return a neutral tone.


 Signal2forex.com - Best Forex robots and signals


