
📑 Table of Contents
1. What Is the IGCS (IG Client Sentiment) Indicator?
The IGCS (IG Client Sentiment) indicator is a powerful sentiment tool that shows the percentage of IG retail traders holding long and short positions across various financial markets. Derived from real-time trading data of over 300,000 clients, IGCS provides a unique window into retail trader positioning and often functions as a contrarian indicator.
Unlike lagging indicators like moving averages, IGCS is a leading indicator that reflects current market psychology. The data is updated in real-time as positions change, making it valuable for short-term trading decisions. According to IG Group data (2026), IGCS is most reliable for FX majors, where trading volumes are highest and sample sizes are largest.
2. How to Read the IGCS Indicator
Reading the IGCS indicator is straightforward once you understand the key metrics. The indicator shows the percentage of traders who are net-long and net-short for each market.
Understanding Net Long vs Net Short
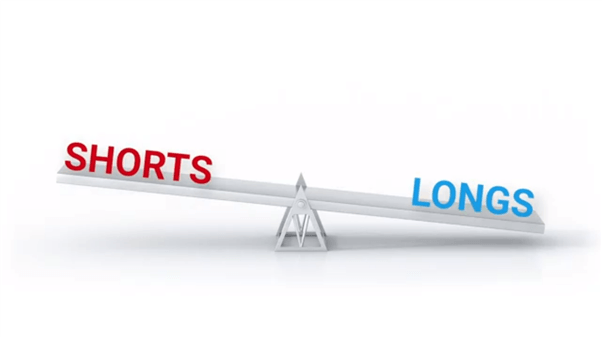
The IGCS displays two key numbers: the percentage of traders who are net-long (buying) and the percentage who are net-short (selling). A reading of 70% net-long means 70% of active IG clients are holding long positions, while 30% are short. This is the raw data that forms the basis of all IGCS analysis.
The Contrarian Principle
The contrarian principle is the foundation of IGCS analysis. Retail traders as a group often misinterpret market direction, buying at tops and selling at bottoms. When the majority are net-long, it can signal a potential price decline; when the majority are net-short, it can signal a potential price increase. Historical data shows that extreme sentiment levels (>70% net-long or >70% net-short) often precede significant reversals.
Daily vs Weekly Changes
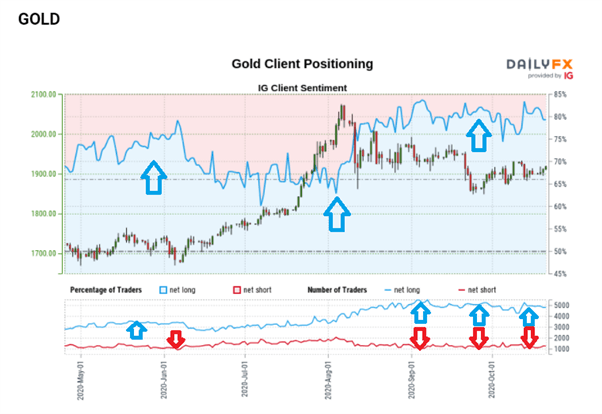
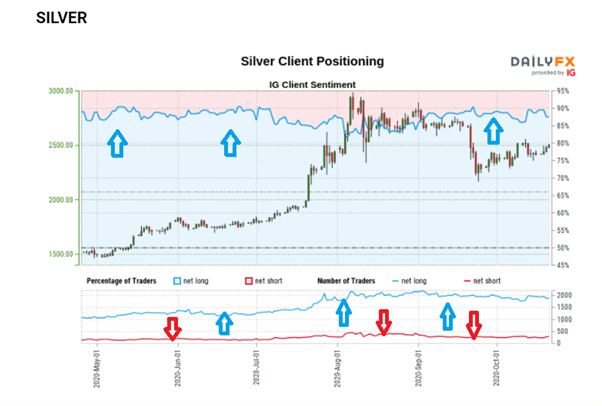
Monitoring daily and weekly changes in IGCS readings provides additional insights. A rapid sentiment shift (>5% in either direction) can indicate that momentum is accelerating or that a reversal is imminent. For gold and silver, which have an inherent long-term bullish bias, monitoring changes rather than absolute levels is often more effective.
3. IGCS Across Different Asset Classes
The reliability of IGCS varies significantly across different asset classes. Understanding these differences is essential for effective application.
FX Majors — The Most Reliable Data
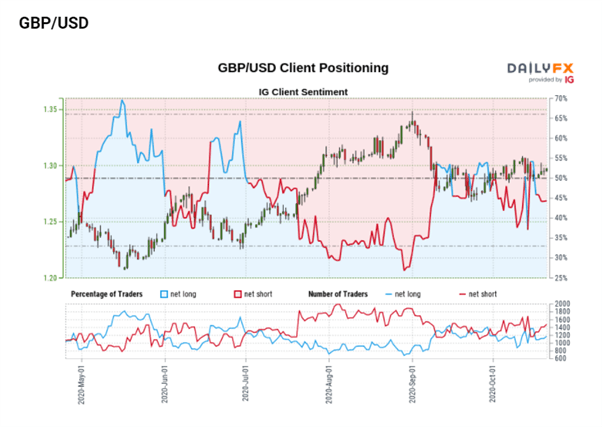
FX majors (EUR/USD, GBP/USD, USD/JPY, AUD/USD) provide the most reliable IGCS data. With the highest trading volumes and largest sample sizes, these markets produce the cleanest contrarian signals. In 2026, typical IGCS readings for EUR/USD show approximately 71% of retail traders net-long, while AUD/USD readings often exceed 78% net-long, suggesting potential downside risk.
Equities and Indices — Benchmark Sentiment
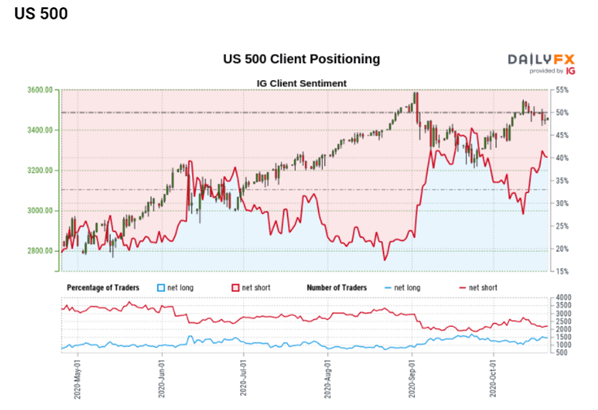
Equity indices like the S&P 500, NASDAQ, DAX, and FTSE 100 are also highly reliable for IGCS analysis. These markets benefit from broad participation and large sample sizes. In 2026, S&P 500 IGCS readings typically show around 62% of retail traders net-long, providing a benchmark for market sentiment.
Commodities — Gold, Silver & Oil
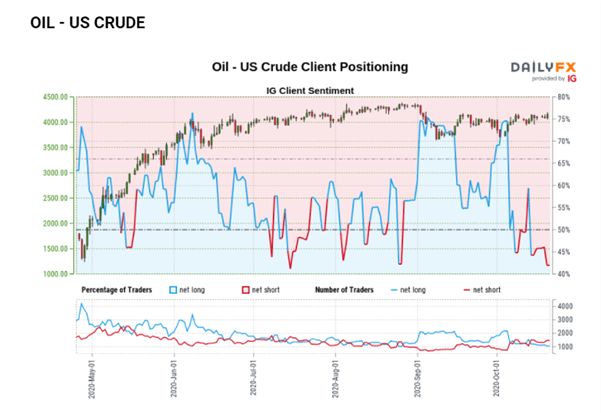
Commodities require a different approach. Gold and silver have an inherent long-term bullish bias, so the standard contrarian approach is less effective. Instead, traders should monitor daily and weekly changes in sentiment for potential entry signals. Oil behaves more like FX, with a less pronounced inherent bias, making it more suitable for standard contrarian analysis.
4. Popular Markets for the IGCS Indicator
The table below shows the most popular markets for IGCS analysis and their key characteristics.
| Market Type | Popular Markets | IGCS Reliability | Key Consideration |
|---|---|---|---|
| FX Majors | EUR/USD, GBP/USD, USD/JPY, AUD/USD | Very High | Large sample size; reliable contrarian signals |
| FX Crosses | EUR/JPY, GBP/JPY, AUD/JPY | Medium-High | Moderate volumes; still useful |
| Equity Indices | S&P 500, NASDAQ, DAX, FTSE 100 | High | Broad market representation |
| Individual Stocks | FAANG, large caps | Low-Medium | May have low trading volumes |
| Commodities | Gold, Silver, Oil | Varies | Gold/Silver have inherent long bias |
📌 FX majors offer the most reliable IGCS data due to the highest trading volumes and largest sample sizes.
5. How to Trade with IGCS: Step-by-Step Strategy
Trading with IGCS requires a systematic approach. Follow these steps to integrate sentiment analysis into your trading.
| Step | Action | Why It Works |
|---|---|---|
| 1. Check Current Reading | Look at % net long vs net short | Establishes baseline sentiment |
| 2. Identify Extremes | Look for readings >70% or <30% | Extreme levels often signal reversals |
| 3. Monitor Daily Change | Track changes >5% in either direction | Rapid shifts indicate momentum changes |
| 4. Confirm with Technicals | Use support/resistance, trendlines | Increases probability of success |
| 5. Execute Trade | Enter in opposite direction of extreme sentiment | Contrarian approach |
📌 Always combine IGCS signals with technical analysis for the highest probability setups.
Identifying Sentiment Extremes
A good contrarian signal typically occurs when the IGCS reading shows >70% net-long or >70% net-short. Extreme levels often indicate that the market is overextended and a reversal may be imminent. For example, when AUD/USD showed 78% net-long in 2026, it preceded a significant downward move.
Combining with Technical Analysis
A contrarian signal from IGCS is stronger when it aligns with a key technical level. Look for support/resistance levels, trendlines, or divergences on RSI or MACD that confirm the sentiment signal. This multi-factor approach significantly increases the probability of success.
Entry and Exit Signals
Consider entering trades when IGCS shows extreme sentiment and price confirms the reversal. Set stop-losses beyond the recent swing high/low and aim for a risk-reward ratio of at least 1:2. Exit when sentiment normalises (returns to 50-60% range) or when price reaches a key technical level.
6. IGCS vs Other Sentiment Indicators
IGCS is just one of several sentiment indicators available to traders. The table below compares IGCS with other popular sentiment tools.
| Indicator | Source | Key Feature | Best Use |
|---|---|---|---|
| IGCS (IG Client Sentiment) | IG retail traders | Real-time positioning data | Contrarian signals, FX & indices |
| COT (Commitment of Traders) | CFTC | Institutional positioning | Long-term trend analysis |
| Put/Call Ratio | Options market | Options flow | Market fear/greed gauge |
| Fear & Greed Index | CNN Business | Multiple factors | Overall market sentiment |
📌 IGCS is best for short-term contrarian signals, while COT is better for long-term trend analysis.

7. Common Mistakes When Using IGCS
Even experienced traders make mistakes when using IGCS. Avoid these common pitfalls:
- Ignoring asset class differences — applying the same approach to gold (with inherent long bias) as to EUR/USD (no inherent bias)
- Using absolute levels without context — not considering daily/weekly changes or broader market conditions
- Failing to combine with technical analysis — using IGCS as a standalone signal without confirmation
- Trading every extreme — not every extreme sentiment reading results in a reversal; wait for price confirmation
- Ignoring sample size — IGCS is less reliable for thinly traded markets with small sample sizes
- Overreacting to daily changes — daily changes should be considered alongside the absolute reading
8. Frequently Asked Questions
What is the IGCS indicator?
IGCS (IG Client Sentiment) is a sentiment indicator that shows the percentage of IG retail traders holding long and short positions in various markets. It is derived from real trading data and often functions as a contrarian indicator.
How does IGCS work as a contrarian indicator?
IGCS works as a contrarian indicator because retail traders often misinterpret market direction. When the majority are net-long, it can signal a potential price decline; when the majority are net-short, it can signal a potential price increase.
Which markets are best for IGCS analysis?
FX majors (EUR/USD, GBP/USD, USD/JPY, AUD/USD) are the most reliable due to high trading volumes and large sample sizes. Equity indices like the S&P 500 and NASDAQ are also highly reliable.
How do you read the IGCS indicator?
The IGCS indicator shows the percentage of traders who are net-long and net-short. A reading above 70% net-long suggests extreme bullish sentiment (bearish contrarian signal). A reading below 30% net-long suggests extreme bearish sentiment (bullish contrarian signal).
Does IGCS work for gold and silver?
Yes, but with a different approach. Gold and silver have an inherent long-term bullish bias, so the standard contrarian approach is less effective. Instead, traders should monitor daily and weekly changes in sentiment for potential entry signals.
What is the difference between IGCS and COT data?
IGCS is based on retail trader positions at IG Group and is updated in real-time. COT (Commitment of Traders) data is based on institutional positions reported weekly by the CFTC. IGCS is better for short-term contrarian signals, while COT is better for long-term trend analysis.
How often is IGCS data updated?
IGCS data is updated in real-time as positions change, making it a valuable leading indicator for short-term trading decisions.
What is a good IGCS reading for a contrarian trade?
A good contrarian signal typically occurs when the IGCS reading shows >70% net-long or >70% net-short. Extreme levels often indicate that the market is overextended and a reversal may be imminent.
Can IGCS be used for trading individual stocks?
IGCS can be used for individual stocks, but it is less reliable due to lower trading volumes. It works best for heavily traded stocks like FAANG companies. For broader sentiment, equity indices are more reliable.
How do I combine IGCS with technical analysis?
Combine IGCS with support/resistance levels, trendlines, and indicators like RSI or MACD. A contrarian signal from IGCS is stronger when it aligns with a key technical level or divergence.
📊 Understand Economic Momentum: While sentiment indicators like IGCS help time entries, understanding the broader economic backdrop is essential. Read our analysis on Services ISM Hits Record High — exploring how record-breaking economic data can influence market sentiment and trading opportunities.
📈 Combine Sentiment with Fundamentals: Market sentiment is just one piece of the puzzle. Explore our guide on CSR: Asset Managers Need to Rethink Governance — learning how corporate governance and ESG factors can impact long-term investment performance and market stability.



 Signal2forex.com - Best Forex robots and signals


