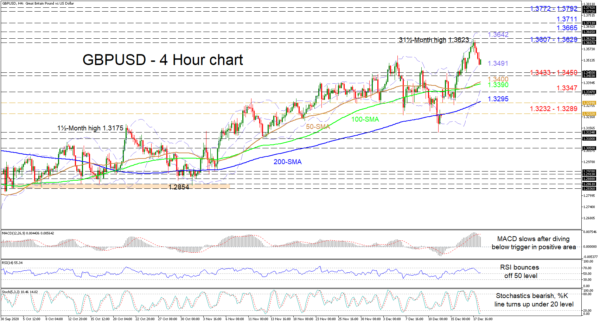
GBPUSD is currently finding some footing on the mid-Bollinger band around 1.3491, after reversing from a resistance band of 1.3607-1.3629, where it formed a 31½-month high of 1.3623. The rising simple moving averages (SMAs) are continuing to back price’s intact bullish demeanour.
The short-term oscillators are reflecting a stall in negative momentum. The MACD’s drop below its red trigger line deep in the positive region, is decelerating, while the RSI has bounced off its neutral threshold and is now pointing higher. In the stochastic oscillator, the %K line although below the 20 mark, is starting to turn back up, reflecting growing positive sentiment.
If buying interest increases further, the pair may encounter initial upside constrictions at the 1.3607-1.3629 ceiling, containing its fresh multi-year peak of 1.3623. Conquering this border, the price may face nearby upside friction from the upper Bollinger band at 1.3642 ahead of the high of 1.3665, identified in May of 2018. Successfully clearing these obstacles, the bulls may aim for the 1.3711 barrier before targeting the 1.3772-1.3792 resistance band.
However, if sellers resurface and manage to steer beneath the mid-Bollinger band around 1.3491, early downside constraints may arise from the limiting region of 1.3433-1.3450. Effectively piercing below this boundary may meet support from the respective 50- and 100-period SMAs at 1.3400 and 1.3390. Diving from here, the decline may falter around the 1.3347 barrier, where the lower Bollinger band resides, as the pair seeks to sink towards the 200-period SMA of 1.3295, adjacent to the trough and upper level of the gap of December 11.
Summarizing, GBPUSD is sustaining its short-term bullish picture above the SMAs and the 1.3433-1.3450 support. That said, a deep retracement could aim to fill the gap of 1.3232-1.3289.
 Signal2forex.com - Best Forex robots and signals


