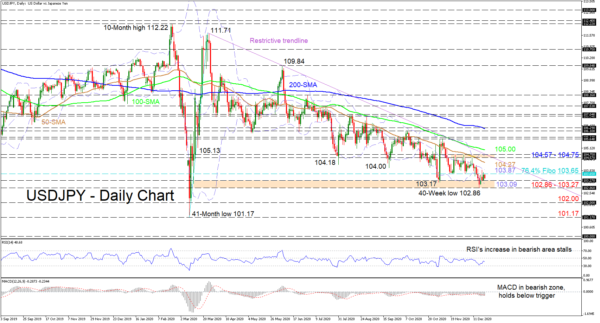
USDJPY is in the process of plummeting further testing key troughs and is currently attached beneath the 103.65 level, which happens to be the 76.4% Fibonacci retracement of the up leg from 101.17 to 111.71. Furthermore, the pair maintains a bearish tone below the dictating simple moving averages (SMAs), and a restrictive trend line pulled from the 111.71 peak.
The technical indicators are also supporting the dominant negative sentiment. The MACD is holding below its red signal line, some distance below the zero mark, while the RSI is struggling to improve, as it points back downwards in bearish territory.
If the pair maintains a southward trajectory, instant downside pressure could develop from the support section of 102.86-103.27, which contains multiple key troughs and the lower Bollinger band at 103.09. If this critical area of boundaries breaks down and the pair decisively dips past the 40-week low of 102.86, the pair may dive towards the 102.00 handle, in-line with the low from March 10. Sinking deeper, traders’ attention may lock onto the 41-month bottom of 101.17.
If buyers manage to push above the immediate 76.4% Fibo of 103.65, next resistance could come from the nearby mid-Bollinger band at 103.87 and the 50-day SMA slightly above at 104.27. Should the pair appreciate further, the obstacle to beat may then be the descending trend line, overlapping the resistance area of 104.57-104.75, which also is encapsulating the upper Bollinger band. Successfully overcoming this could see buyers face the 100-day SMA at the 105.00 mark, before further hikes can unfold.
Summarizing, USDJPY continues to possess a deteriorating bias in the short-to-medium-term timeframe beneath the SMAs. A close below the 102.86 may cement negative worries while a break above 104.57-104.75, may breathe some oxygen into an improving picture.
 Signal2forex.com - Best Forex robots and signals


