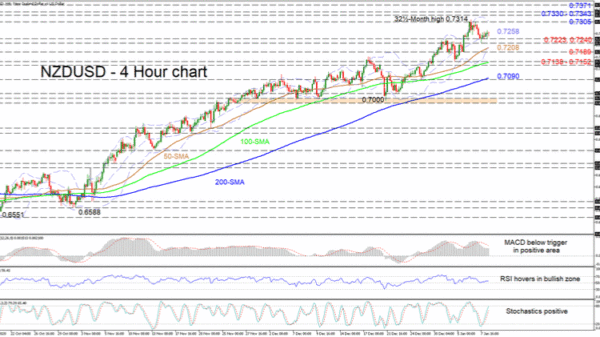
NZDUSD is currently tracing the mid-Bollinger band in the four-hour chart after a slight pullback from the recently plotted 32½-month peak of 0.7314. Despite the small retracement in the pair, the commanding simple moving averages (SMAs) are backing the predominant bullish picture.
The short-term oscillators are reflecting conflicting signals in directional momentum, though are leaning somewhat to the upside. The MACD remains in the positive region but has plunged some distance below its red trigger line, while the RSI is floating marginally above the 50 threshold. That said the stochastic oscillator possesses a robust positive charge, endorsing additional price gains.
If the pair experiences a surge in buying interest the price may push off the mid-band towards initial resistance, located at the 0.7305 high and the adjacent multi-year peak of 0.7314. Conquering the upper Bollinger band area, the pair could challenge the 0.7330-0.7343 resistance boundary, involving multiple highs from mid-April of 2018. Successfully overcoming this too, the price may then shoot for the 0.7371 target.
On the flipside, if sellers manage to steer the price below the mid-Bollinger band at 0.7258, early support could develop around the respective 0.7240 and 0.7223 lows. Another leg down may meet the reinforced 50-period SMA at 0.7208 ahead of the 0.7189 trough. A deeper retreat from here may need to conquer the hardened region of 0.7138-0.7152, which also contains the 100-period SMA, to sustain a significant decline.
Concluding, the short-term picture remains strongly bullish above the SMAs and the 0.7000 trough. A dip under 0.7223 or a positive push off the mid- Bollinger band could determine the next price direction.


 Signal2forex.com - Best Forex robots and signals


