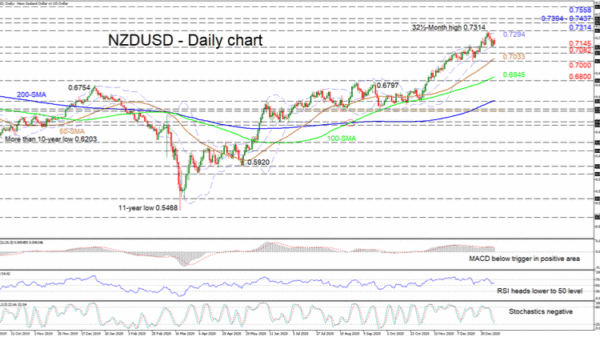
NZDUSD appears to have found some footing on the mid-Bollinger band after receding from a recently reached 32½-month peak of 0.7314. The short-term technical indicators are revealing some weakness in positive momentum, while the soaring simple moving averages (SMAs) are endorsing a robust bullish picture.
The MACD, some distance above zero, is fading below its red trigger line, while the downwards pointing RSI looks to be heading towards the 50 threshold. Furthermore, the negatively charged stochastic oscillator is promoting a slight deeper retracement before the ascent resumes.
If the price dips underneath the mid-Bollinger band around 0.7145, downside friction could next be found at the 0.7082 low. Should selling interest intensify, the pair may target the 50-day SMA at 0.7033, which has merged with the lower Bollinger band, ahead of the critical trough of 0.7000. Additional loss of ground could then sink the price towards the 100-day SMA at 0.6845 ahead of the 0.6800 barrier.
If the bounce on the mid-Bollinger band evolves, early resistance could develop at the upper Bollinger band at 0.7294 and the multi-year peak of 0.7314 overhead. Conquering the top, the bulls may then aim for the 0.7394-0.7437 resistance section, involving highs over a seven-month period ending April 2018. Overcoming this tough border as well, the price may propel towards the 0.7558 peak, identified in July 2017.
Concluding, in the short-term timeframe NZDUSD retains a sturdy positive structure above the SMAs and the critical boundary of 0.7000.


 Signal2forex.com - Best Forex robots and signals


